Banking analytics platform
Unlocking Financial Insights: A Deep Dive into Industry Trends and Analysis
Our Banking Analytics Platform offers a powerful solution for unlocking financial insights and understanding industry trends. Designed to provide deep, actionable analysis, this platform empowers banks and financial institutions with the tools they need to thrive in a competitive landscape.
Baishakh, 2083, Industry: Commercial banks
Total Assets
89.69 Kh
Last Month: 88.98 Kh
Total Liabilities
89.69 Kh
Last Month: 88.98 Kh
Total Deposits
71.97 Kh
Last Month: 71.36 Kh
Total Loan
52.38 Kh
Last Month: 52.51 Kh
Profit and Loss
56.47 Ar
Last Month: 49.21 Ar
Total Expense
4.71 Kh
Last Month: 4.28 Kh
Monthly Analysis and Report
Annual/Quarterly report and analysis
Industry Analytics and Report Overview
Unlock the power of data with Tathyanka's Industry Analytics and Report Overview. Our platform provides a comprehensive analysis of industry trends and benchmarks, offering valuable insights to help you stay competitive in the dynamic financial landscape.
With our detailed reports, you gain access to:
- Market Trends: Understand the latest trends and shifts within the banking industry
- Performance Benchmarks: Compare your institution's performance against industry standards.
- Risk Analysis: Identify potential risks and challenges to proactively manage them.
- Growth Opportunities: Discover areas with potential for expansion and improvement.
Our analytics tools turn complex data into actionable intelligence through intuitive visualizations and in-depth reports. Whether you are a financial analyst, bank executive, or business strategist, Tathyanka equips you with the knowledge to make informed, strategic decisions. Stay ahead with accurate, timely, and relevant industry analytics.
Monthly Financial Insights and Analytics

Stay ahead of the curve with Tathyanka's comprehensive monthly financial insights and analytics. Our service collects and analyzes your bank's monthly data, transforming complex information into clear, visual representations. With our in-depth reports, you'll gain valuable insights into financial trends, performance metrics, and key indicators that matter most to your business. Make informed decisions with ease, backed by accurate and timely data analysis. Explore our visualizations to understand your financial standing and identify opportunities for growth and improvement.
Key Elements of Monthly Report and Analysis
KPI Dashboards
Gain a quick and comprehensive view of your bank’s performance with our KPI Dashboards. These dashboards showcase essential Key Performance Indicators (KPIs) in an easy-to-understand visual format, helping you monitor critical metrics and make data-driven decisions efficiently.
Income statement and Profit/Loss Account
Understand your bank's financial health with detailed income statements and profit/loss accounts. Our reports break down revenue streams, expenses, and net income, providing clear insights into profitability and financial performance over the month.
Assets and liabilities
Track your bank's financial stability by analyzing assets and liabilities. Our reports offer a detailed overview of your bank's balance sheet, helping you assess financial position, liquidity, and long-term solvency.
Lending and Deposits
Monitor your bank’s core activities with detailed analyses of lending and deposit trends. Our insights help you understand loan growth, deposit inflows, and customer behavior, enabling better management of your financial products and services.
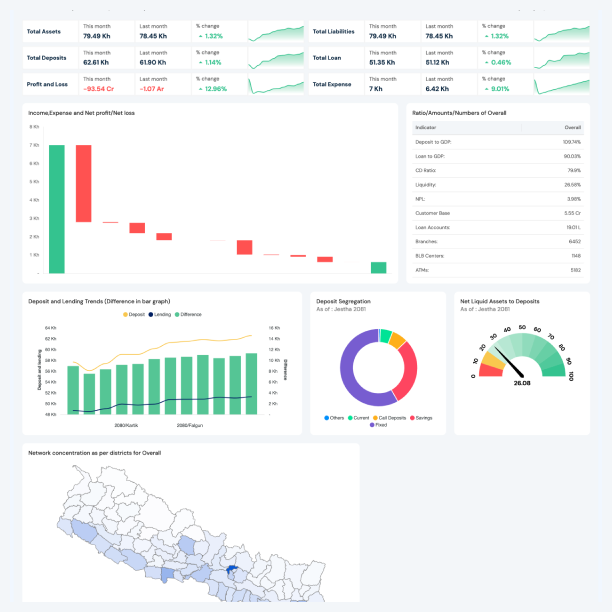
Bank map and Interest Rates
Visualize geographical data and interest rate trends with our Bank Map and Interest Rates analysis. This feature helps you see how your bank's interest rates compare regionally and understand spatial patterns in banking activities.
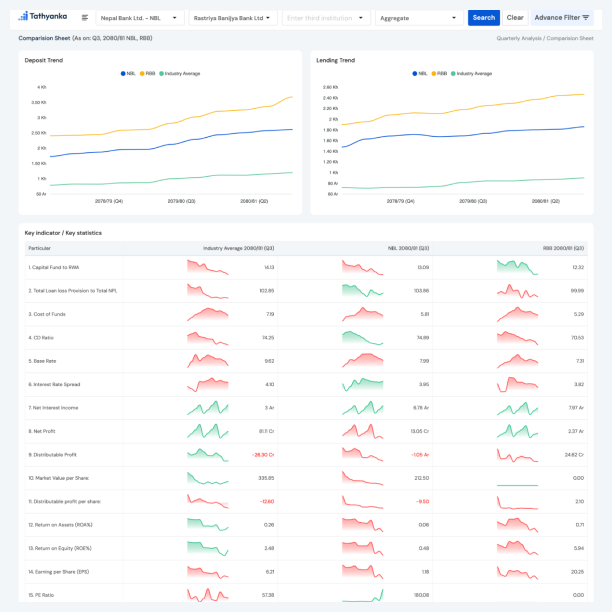
Comparison sheet
Benchmark your bank’s performance against industry standards and competitors with our Comparison Sheet. This tool allows you to identify strengths and weaknesses by comparing key financial metrics, helping you strategize for improvement and growth.
Quarterly and Annual reports
Stay informed and make strategic decisions with Tathyanka's comprehensive Quarterly and Annual Reports. Our detailed reports offer an in-depth analysis of your bank's financial performance, providing a clear picture of trends and developments over the medium and long term.
With Tathyanka's Quarterly and Annual Reports, you gain valuable insights that help you understand your bank's financial health, make informed decisions, and plan for future growth. Our reports are designed to be clear, accurate, and actionable, providing you with the information you need to stay ahead in a competitive financial landscape.
Key Elements of Quarterly and Annual reports
Bank report Summary
Our Bank Report Summary provides a concise overview of your bank's key financial metrics and performance indicators. This summary distills complex data into an easy-to-read format, highlighting the most critical information at a glance. It is designed to give you a quick understanding of your bank's financial health and recent performance trends.
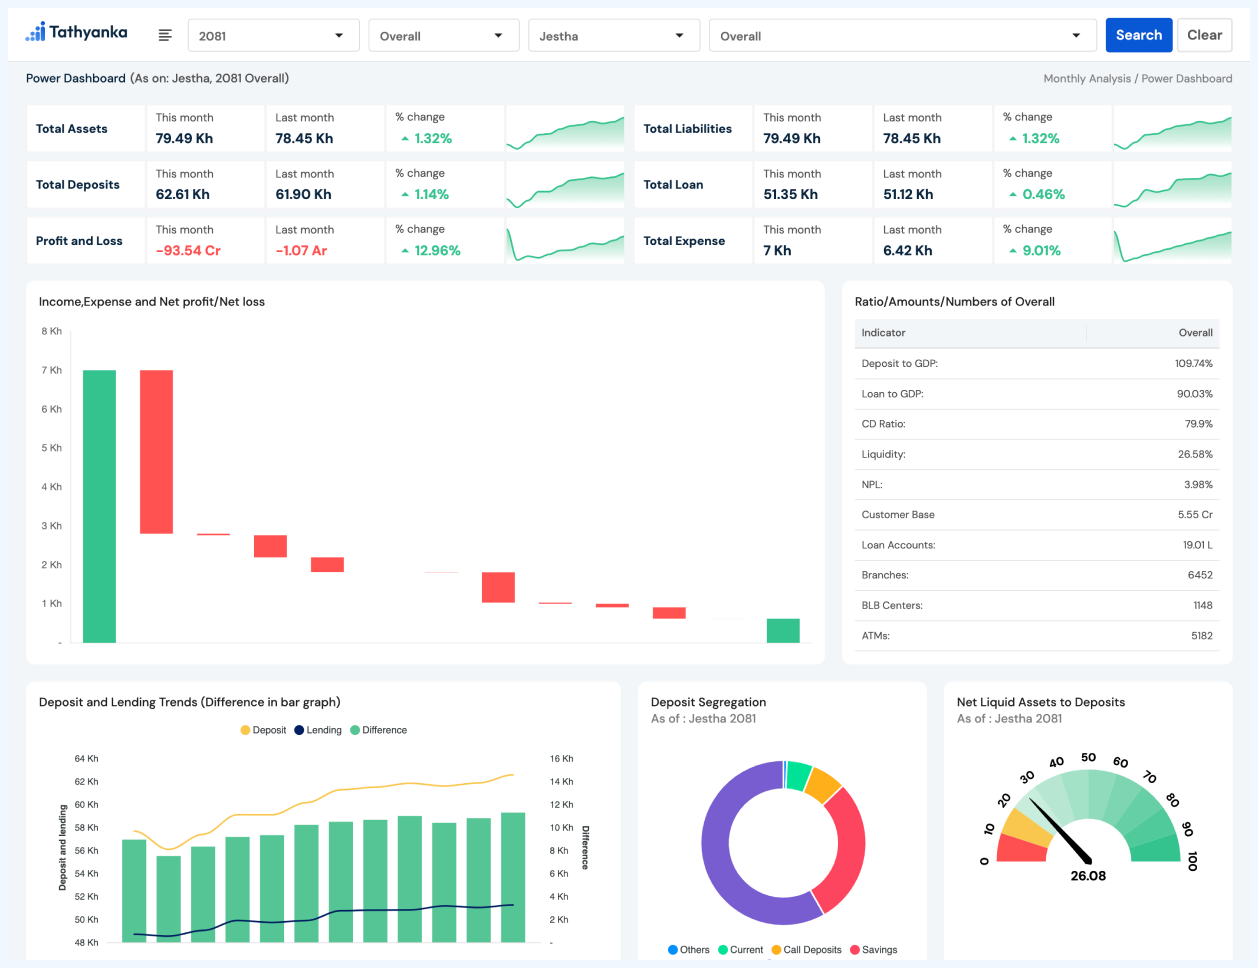
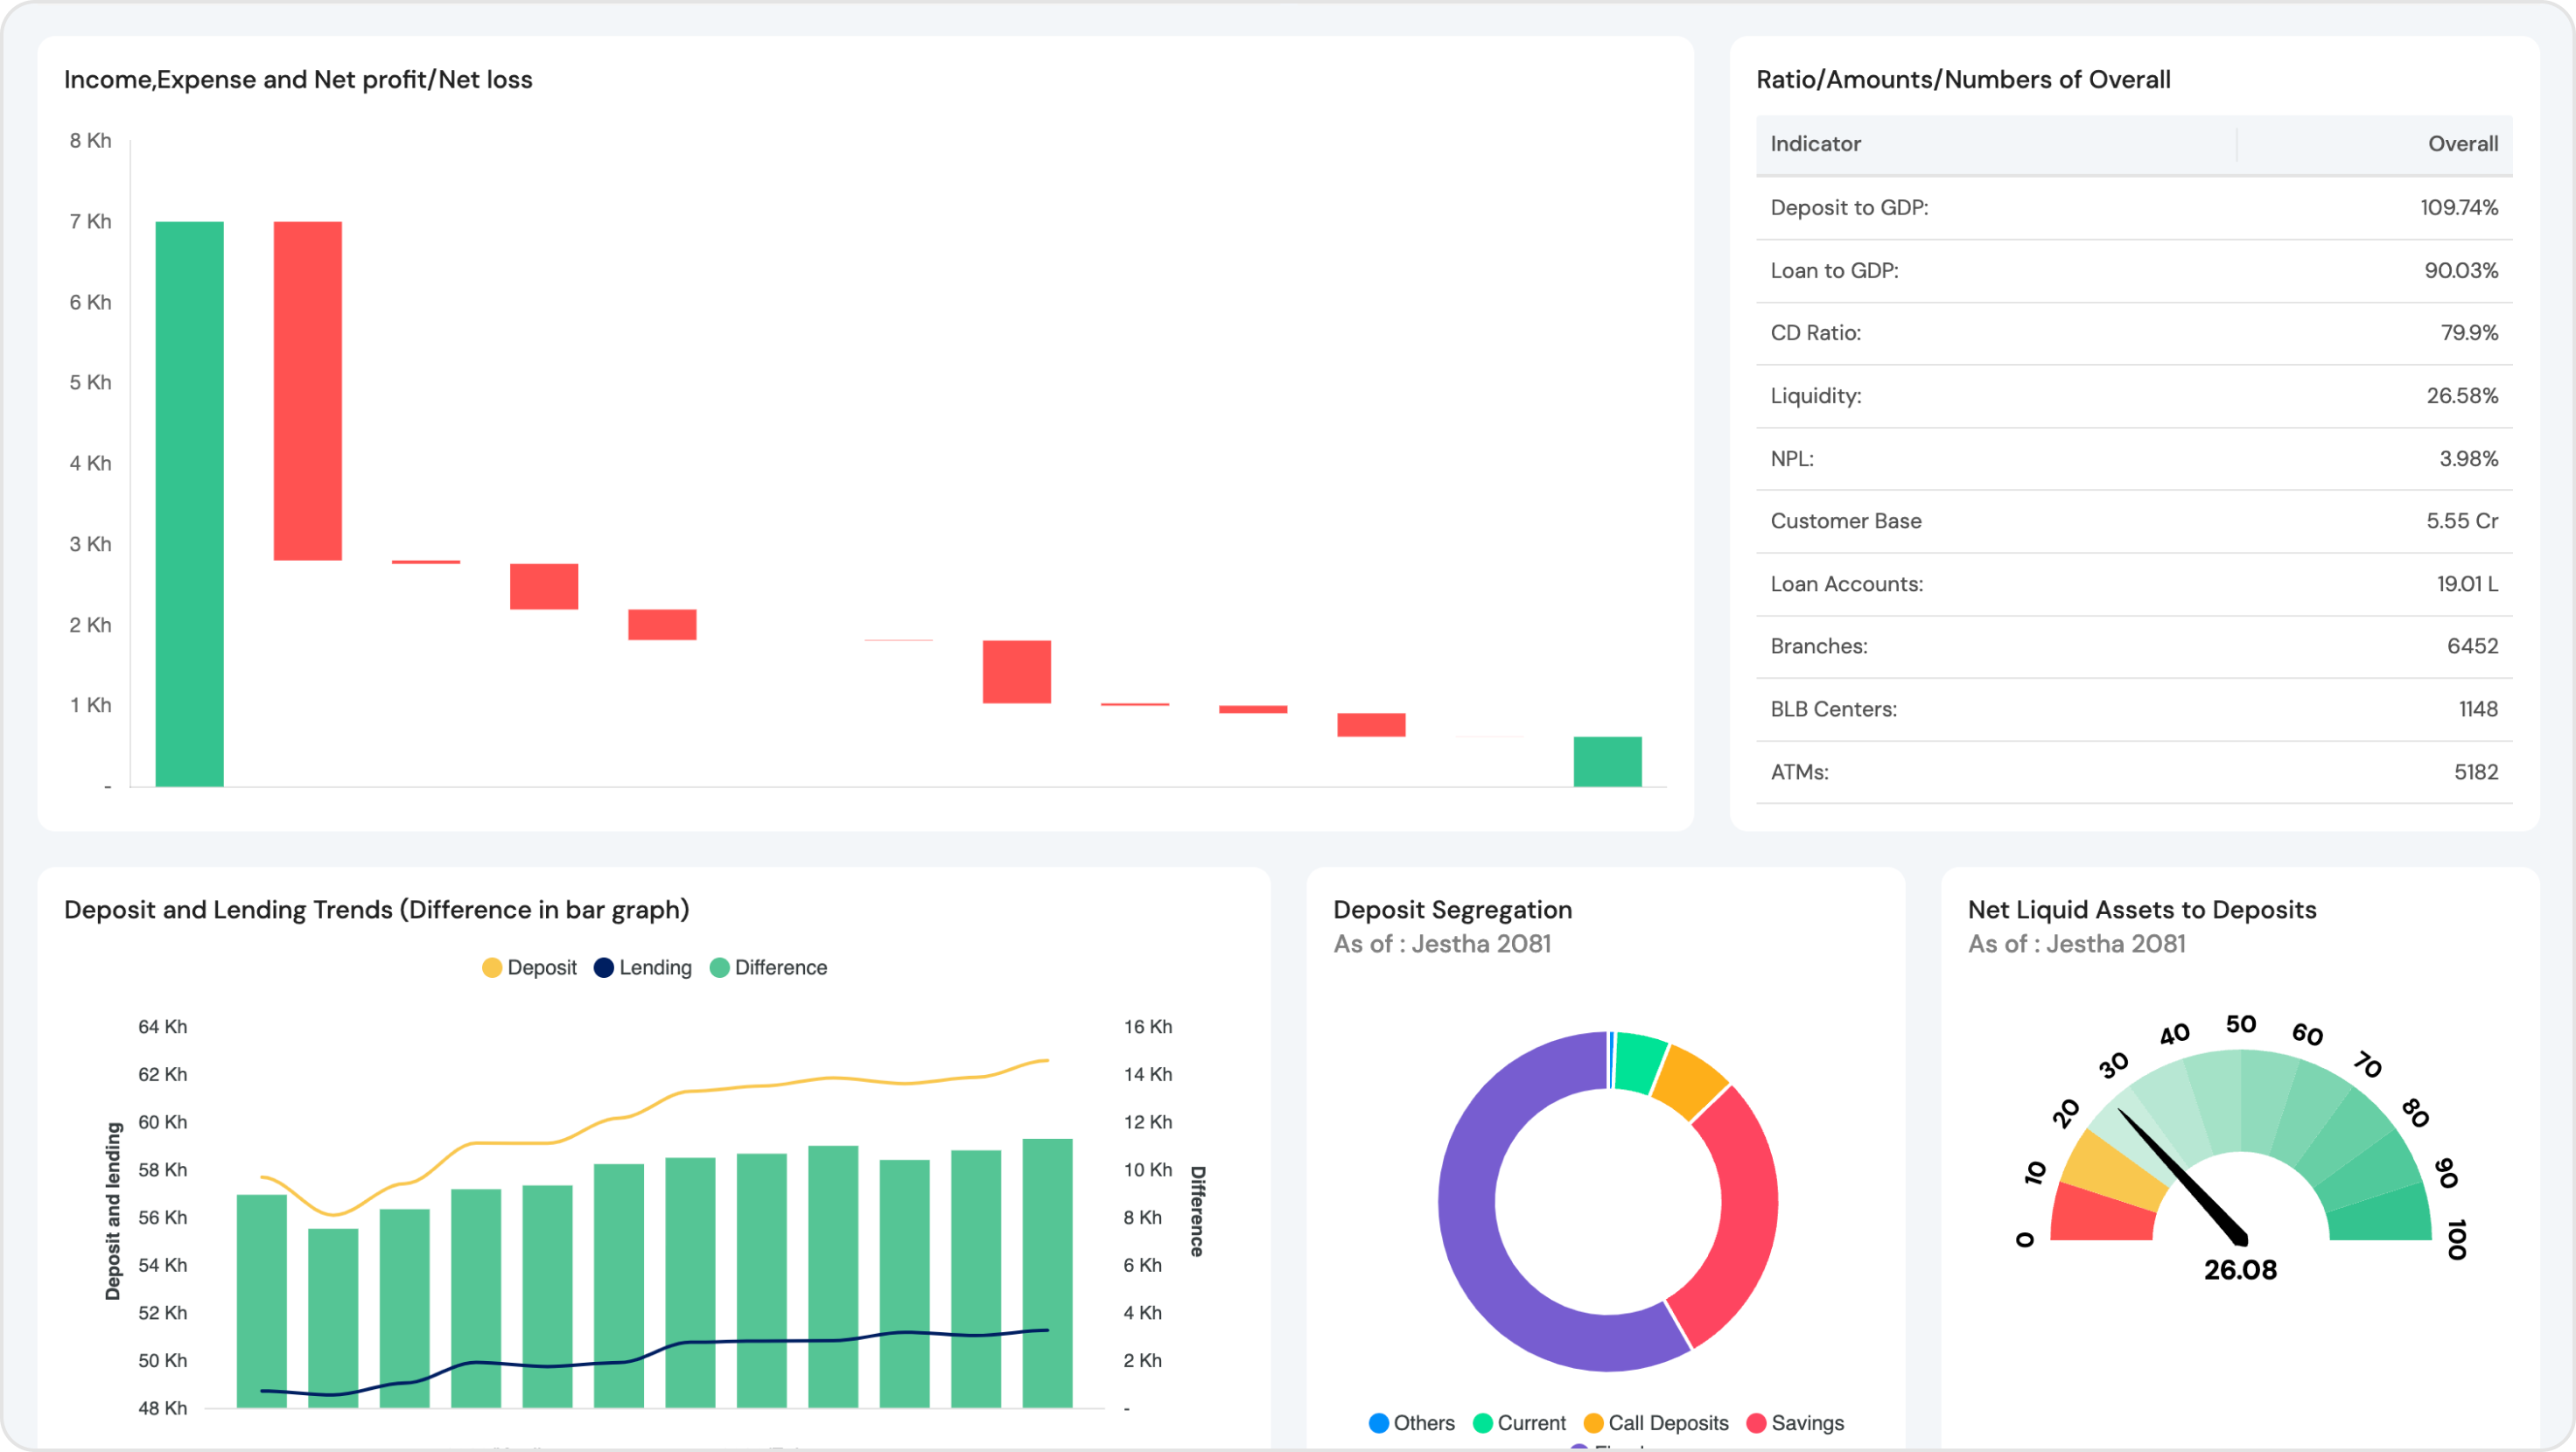
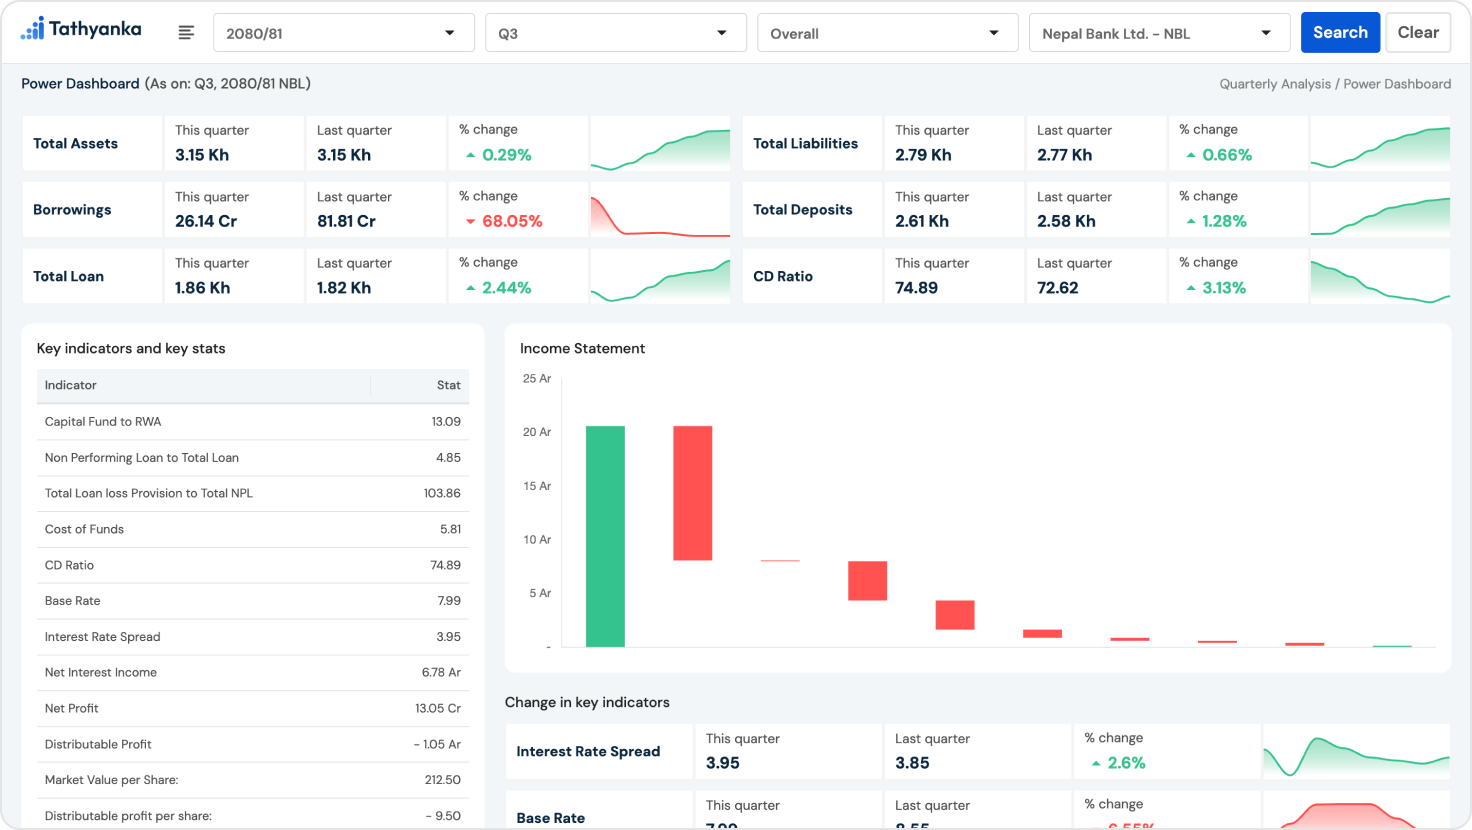
Power Dashboard
The Power Dashboard is an interactive tool that visualizes your bank's data through dynamic charts, graphs, and tables. It allows you to explore and analyze key performance indicators in real-time, providing deep insights into financial trends, operational efficiency, and market conditions. With intuitive navigation and customizable views, the Power Dashboard helps you make informed decisions quickly and effectively.
Comparison Sheet
Our Comparison Sheet enables you to benchmark your bank’s performance against industry standards and competitors. This tool provides side-by-side comparisons of critical financial metrics, helping you identify strengths, weaknesses, and areas for improvement. Use the Comparison Sheet to understand your competitive position and drive strategic initiatives for better performance.
Analytics Platform Key Benefits
Comprehensive Analysis
Our platform offers a comprehensive analysis of economic, liquidity, banking, and capital market insights, utilizing a range of techniques to provide a complete view of the market and enable informed investment decisions.
Interactive Visualization
With our visually stunning and interactive data visualizations, investors can explore complex data sets with ease, identify potential risks and opportunities in the market, and adjust parameters to explore different scenarios.
Valuable Insights
Our platform provides investors with valuable insights into economic factors that drive growth, inflation, and employment rates, as well as liquidity and banking trends, helping them stay up-to-date with the latest market trends and make informed investment decisions based on real-time data.
Interested in Our Latest Updates? Subscribe our newsletter
Subscribe our newsletter to get our latest update & news straight to your inbox


Tathyanka is a data analytics platform developed by dynamic group of industry experts and IT specialists with an aim to create optimal data visualization for thorough analytics.


