Financial Report of all 20 Nepalese Commercial Banks has been released for Q4, 2080/81. The report seems to be the mix of better, bitter and impressive performance by the Banks. In this article, we shall be looking into major financial highlights, performance indicators and major ratios of Commercial Banks of Nepal based on their Q4 reports.
Deposit Performance Analysis
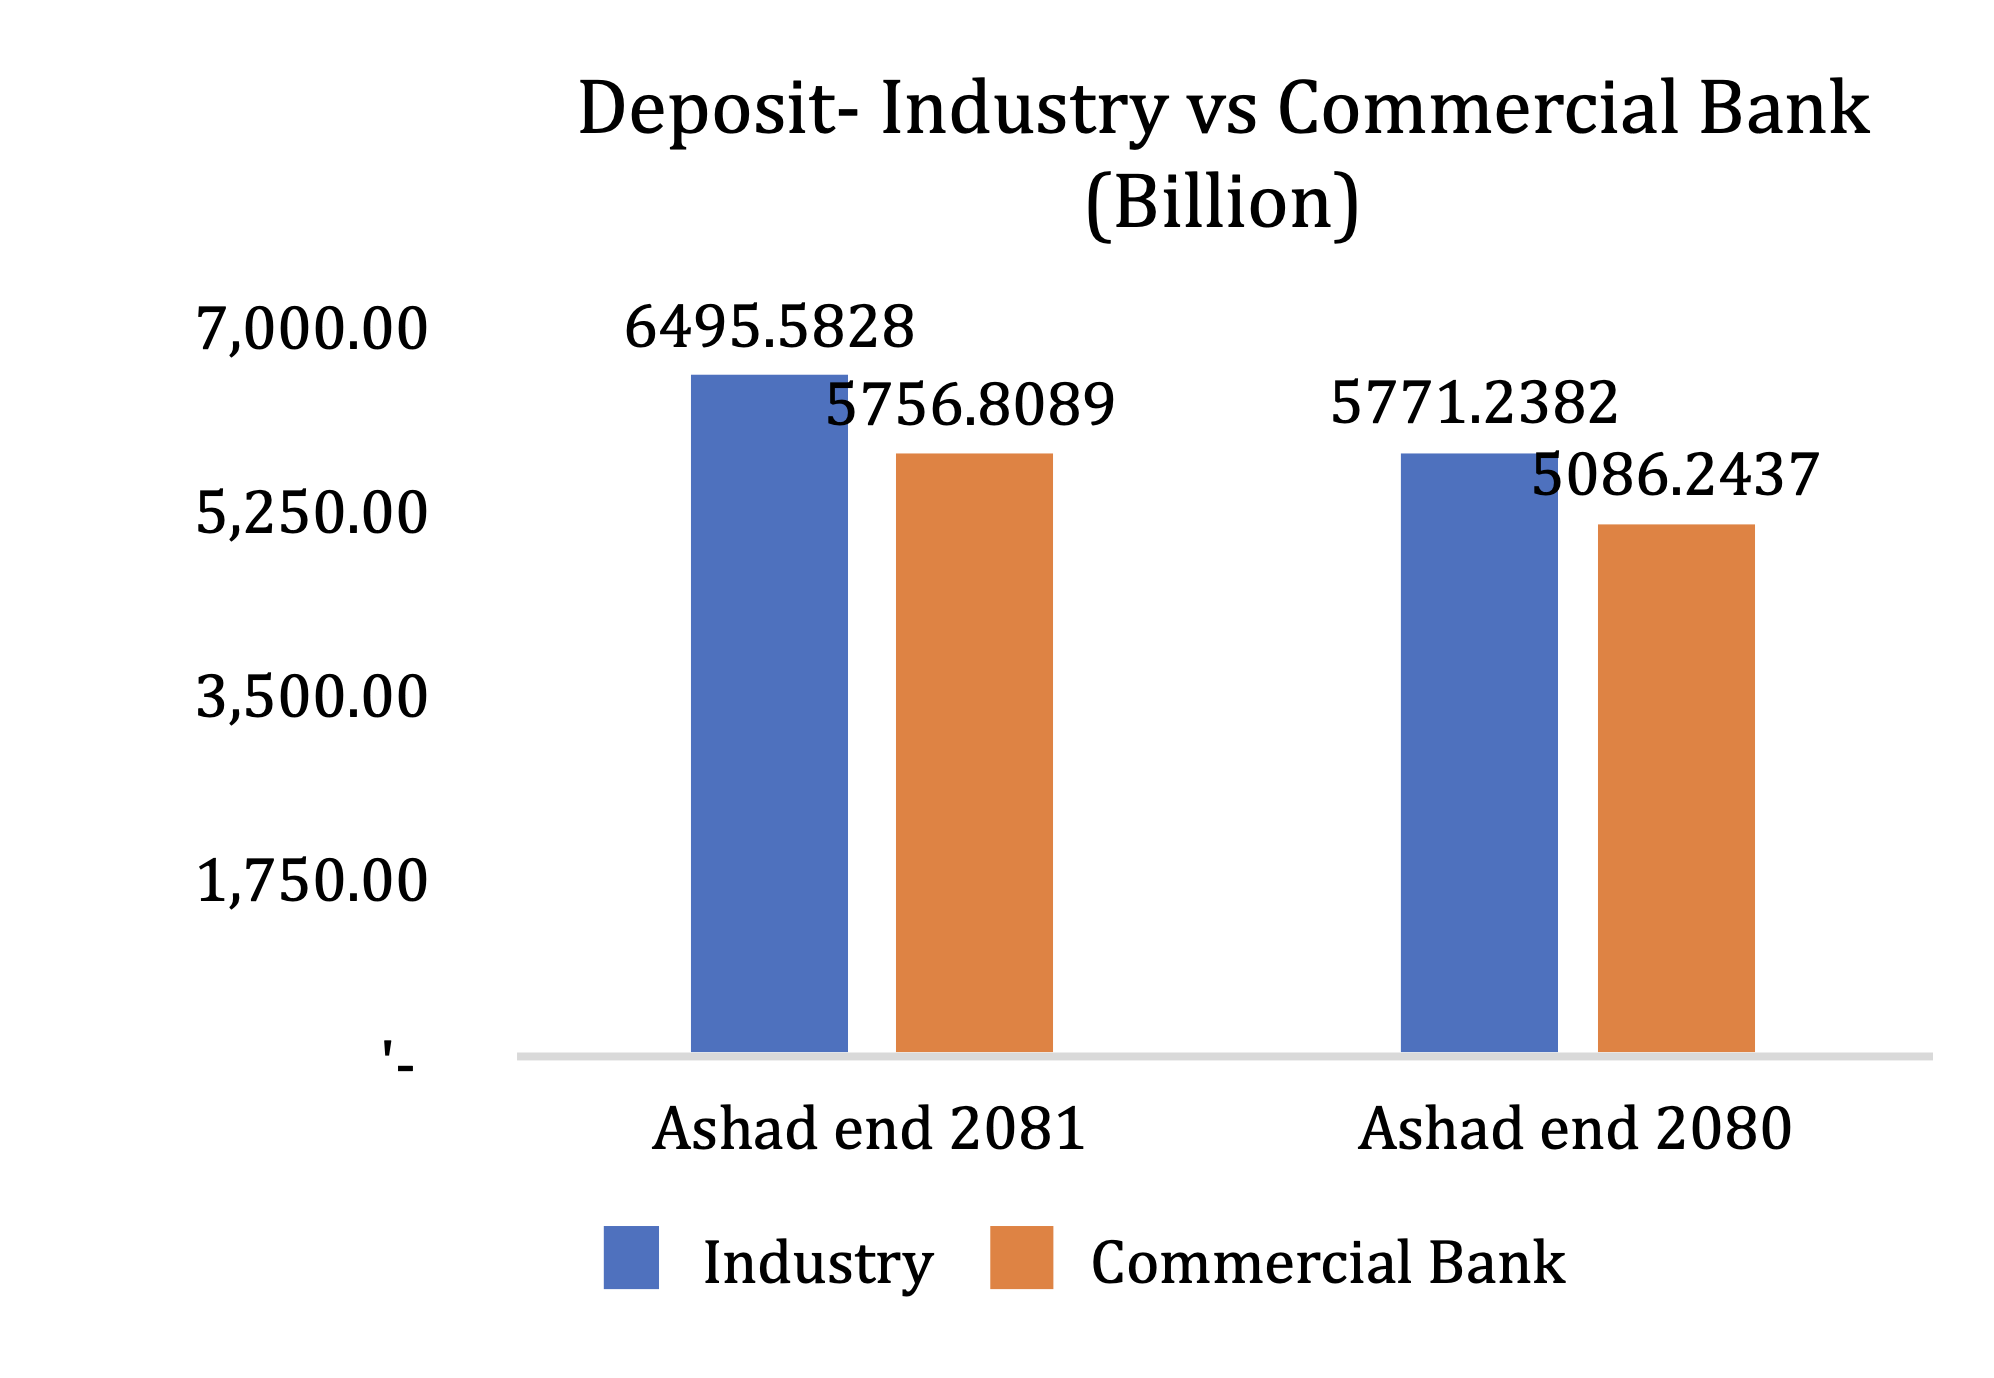
All the commercial Banks except Standard Chartered Bank Nepal managed to increase their Deposit Volume during the review period. Overall deposits of Commercial Banks grew by 11.43% on an average during the review period. Global IME Bank’s deposit portfolio remained highest at Rs.504.90 Billion followed by Nabil Bank Limited at Rs.468.77 Billion. In terms of Y-o-Y growth Rastriya Banijye Bank’s deposit grew by 33.35% and remained at Rs.430.71 Billion, followed by Prime Commercial Bank with 23.97% increment. Lowest Deposit is being held by Standard Chartered Bank Nepal at Rs.114.83 Billion.
Rs. in Billion
|
Bank
|
Ashadh 2080
|
Ashadh 2081
|
Change (Rs.)
|
Change (%)
|
Ranking
|
|
Global
|
439.35
|
504.90
|
65.55
|
14.92%
|
1
|
|
Nabil
|
403.12
|
468.77
|
65.65
|
16.29%
|
2
|
|
RBB
|
322.98
|
430.71
|
107.73
|
33.35%
|
3
|
|
NIMB
|
360.22
|
406.81
|
46.58
|
12.93%
|
4
|
|
NIC Asia
|
315.34
|
362.44
|
47.10
|
14.94%
|
5
|
|
Kumari
|
325.28
|
347.83
|
22.55
|
6.93%
|
6
|
|
LaxmiSunrise
|
300.31
|
333.40
|
33.09
|
11.02%
|
7
|
|
Parbhu
|
297.09
|
312.23
|
15.14
|
5.09%
|
8
|
|
HBL
|
280.50
|
297.73
|
17.23
|
6.14%
|
9
|
|
NBL
|
245.79
|
283.56
|
37.77
|
15.37%
|
10
|
|
SBL
|
235.27
|
244.91
|
9.64
|
4.10%
|
11
|
|
ADBL
|
201.58
|
243.79
|
42.20
|
20.94%
|
12
|
|
EBL
|
199.23
|
233.39
|
34.16
|
17.15%
|
13
|
|
NMB
|
213.04
|
227.11
|
14.06
|
6.60%
|
14
|
|
Prime
|
178.57
|
221.37
|
42.80
|
23.97%
|
15
|
|
Sanima
|
180.84
|
199.38
|
18.54
|
10.25%
|
16
|
|
Citizen
|
172.56
|
191.67
|
19.12
|
11.08%
|
17
|
|
NSBI
|
154.84
|
179.24
|
24.41
|
15.76%
|
18
|
|
MBL
|
158.28
|
161.78
|
3.49
|
2.21%
|
19
|
|
SCBNL
|
122.49
|
114.83
|
(7.67)
|
-6.26%
|
20
|
|
Average industry
|
255.33
|
288.29
|
32.96
|
11.43%
|
|
Created with Highcharts 11.4.8BanksDeposit (Rs. in Billion)Percentage Change (%)Deposit Performance Analysis439.35439.35403.12403.12322.98322.98360.22360.22315.34315.34325.28325.28300.31300.31297.09297.09280.5280.5245.79245.79235.27235.27201.58201.58199.23199.23213.04213.04178.57178.57180.84180.84172.56172.56154.84154.84158.28158.28122.49122.49504.9504.9468.77468.77430.71430.71406.81406.81362.44362.44347.83347.83333.4333.4312.23312.23297.73297.73283.56283.56244.91244.91243.79243.79233.39233.39227.11227.11221.37221.37199.38199.38191.67191.67179.24179.24161.78161.78114.83114.8365.5565.5565.6565.65107.73107.7346.5846.5847.147.122.5522.5533.0933.0915.1415.1417.2317.2337.7737.779.649.6442.242.234.1634.1614.0614.0642.842.818.5418.5419.1219.1224.4124.413.493.49-7.67-7.67255.334255.334255.334255.334255.334255.334255.334255.334255.334255.334255.334255.334255.334255.334255.334255.334255.334255.334255.334255.334255.334255.334255.334255.334255.334255.334255.334255.334255.334255.334255.334255.334255.334255.334255.334255.334255.334255.334255.334255.334288.2925288.2925288.2925288.2925288.2925288.2925288.2925288.2925288.2925288.2925288.2925288.2925288.2925288.2925288.2925288.2925288.2925288.2925288.2925288.2925288.2925288.2925288.2925288.2925288.2925288.2925288.2925288.2925288.2925288.2925288.2925288.2925288.2925288.2925288.2925288.2925288.2925288.2925288.2925288.292514.9214.9216.2916.2933.3533.3512.9312.9314.9414.946.936.9311.0211.025.095.096.146.1415.3715.374.14.120.9420.9417.1517.156.66.623.9723.9710.2510.2511.0811.0815.7615.762.212.21-6.26-6.26Ashadh 2080Ashadh 2081Change (Rs. in Billion)Average Industry (Ashadh 2080)Average Industry (Ashadh 2081)Percentage Change (%)GlobalNabilRBBNIMBNIC AsiaKumariLaxmiSunriseParbhuHBLNBLSBLADBLEBLNMBPrimeSanimaCitizenNSBIMBLSCBNL-2000200400600-120122436Highcharts.com
Analysis - 3 : Net Interest Income (NII)
 |
What Does Net Interest Income (NII) mean to Banks?
Interest Income is recognized on interest bearing advances and financial assets whose income is booked to statement of profit or loss under interest income, whereas Interest Expenses is booked on interest bearing deposits or financial liabilities whose expenses is booked in statement of profit or loss under interest expenses. The net difference between these income and expenses is referred as Net Interest Income (NII).
|
Net Interest Income (NII) Performance Analysis:
NII being the major source of Bank’s revenue is a primary area to focus for Banks. NII of 13 Commercial Banks shows negative growth whereas of 7 Banks managed to increase their NII as on Ashadh 2081. Leading the NII in terms of highest amount is Global IME Bank with NII of Rs.16,637.92 Million followed by Nabil Bank with Rs.16,207.01 Million. Though the Y-o-Y growth of both the banks is down by 2.74% and 8.69% respectively. In terms of highest Y-O-Y growth Laxmi Sunrise Bank managed to increase its NII by hefty 103.97% from Rs.5,656.69 Million to Rs.11,598.89 Million thanks to its merger synergy. In terms of lowest Y-o-Y growth, Standard Chartered Bank Nepal’s NII fell by 13.46% followed by NIC ASIA Bank and Rastriya Banijye Bank with fall of 13.39% each. In terms of amount lowest NII was reported by Machhapuchhere Bank Limited of Rs.5,009.09 Million. Industry Average NII growth stands at 3.16%.
Rs. in Million
|
Bank
|
Ashadh 2080
|
Ashadh 2081
|
Change (Rs.)
|
Change%
|
Ranking
|
|
Global
|
17,106.99
|
16,637.92
|
(469.07)
|
-2.74%
|
1
|
|
Nabil
|
17,748.84
|
16,207.01
|
(1,541.83)
|
-8.69%
|
2
|
|
NIMB
|
12,307.10
|
15,017.17
|
2,710.07
|
22.02%
|
3
|
|
Parbhu
|
10,066.44
|
12,022.55
|
1,956.11
|
19.43%
|
4
|
|
HBL
|
9,920.78
|
11,619.41
|
1,698.63
|
17.12%
|
5
|
|
LaxmiSunrise
|
5,686.69
|
11,598.89
|
5,912.20
|
103.97%
|
6
|
|
Kumari
|
11,066.18
|
10,986.86
|
(79.31)
|
-0.72%
|
7
|
|
NIC Asia
|
12,258.81
|
10,617.17
|
(1,641.64)
|
-13.39%
|
8
|
|
RBB
|
11,816.23
|
10,234.09
|
(1,582.13)
|
-13.39%
|
9
|
|
ADBL
|
8,195.66
|
10,124.28
|
1,928.62
|
23.53%
|
10
|
|
NBL
|
9,406.95
|
8,802.11
|
(604.84)
|
-6.43%
|
11
|
|
Prime
|
7,140.75
|
8,009.15
|
868.40
|
12.16%
|
12
|
|
SBL
|
8,184.54
|
7,993.58
|
(190.96)
|
-2.33%
|
13
|
|
EBL
|
7,412.44
|
7,660.55
|
248.11
|
3.35%
|
14
|
|
NMB
|
8,342.46
|
7,497.06
|
(845.40)
|
-10.13%
|
15
|
|
Sanima
|
6,478.62
|
6,178.06
|
(300.56)
|
-4.64%
|
16
|
|
Citizen
|
5,828.50
|
5,686.16
|
(142.34)
|
-2.44%
|
17
|
|
SCBNL
|
5,956.03
|
5,154.49
|
(801.53)
|
-13.46%
|
18
|
|
NSBI
|
5,767.27
|
5,072.97
|
(694.30)
|
-12.04%
|
19
|
|
MBL
|
5,372.40
|
5,009.09
|
(363.31)
|
-6.76%
|
20
|
|
Average industry
|
9,303.18
|
9,606.43
|
303.25
|
3.16%
|
|
Created with Highcharts 11.4.8BanksNet Interest Income (NII) (Rs. in Million)Percentage Change (%)Net Interest Income (NII) Performance Analysis17 106.9917 106.9917 748.8417 748.8412 307.112 307.110 066.4410 066.449 920.789 920.785 686.695 686.6911 066.1811 066.1812 258.8112 258.8111 816.2311 816.238 195.668 195.669 406.959 406.957 140.757 140.758 184.548 184.547 412.447 412.448 342.468 342.466 478.626 478.625 828.55 828.55 956.035 956.035 767.275 767.275 372.45 372.416 637.9216 637.9216 207.0116 207.0115 017.1715 017.1712 022.5512 022.5511 619.4111 619.4111 598.8911 598.8910 986.8610 986.8610 617.1710 617.1710 234.0910 234.0910 124.2810 124.288 802.118 802.118 009.158 009.157 993.587 993.587 660.557 660.557 497.067 497.066 178.066 178.065 686.165 686.165 154.495 154.495 072.975 072.975 009.095 009.09-469.07-469.07-1 541.83-1 541.832 710.072 710.071 956.111 956.111 698.631 698.635 912.25 912.2-79.31-79.31-1 641.64-1 641.64-1 582.13-1 582.131 928.621 928.62-604.84-604.84868.4868.4-190.96-190.96248.11248.11-845.4-845.4-300.56-300.56-142.34-142.34-801.53-801.53-694.3-694.3-363.31-363.319 303.1849 303.1849 303.1849 303.1849 303.1849 303.1849 303.1849 303.1849 303.1849 303.1849 303.1849 303.1849 303.1849 303.1849 303.1849 303.1849 303.1849 303.1849 303.1849 303.1849 303.1849 303.1849 303.1849 303.1849 303.1849 303.1849 303.1849 303.1849 303.1849 303.1849 303.1849 303.1849 303.1849 303.1849 303.1849 303.1849 303.1849 303.1849 303.1849 303.1849 606.42859 606.42859 606.42859 606.42859 606.42859 606.42859 606.42859 606.42859 606.42859 606.42859 606.42859 606.42859 606.42859 606.42859 606.42859 606.42859 606.42859 606.42859 606.42859 606.42859 606.42859 606.42859 606.42859 606.42859 606.42859 606.42859 606.42859 606.42859 606.42859 606.42859 606.42859 606.42859 606.42859 606.42859 606.42859 606.42859 606.42859 606.42859 606.42859 606.4285-2.74-2.74-8.69-8.6922.0222.0219.4319.4317.1217.12103.97103.97-0.72-0.72-13.39-13.39-13.39-13.3923.5323.53-6.43-6.4312.1612.16-2.33-2.333.353.35-10.13-10.13-4.64-4.64-2.44-2.44-13.46-13.46-12.04-12.04-6.76-6.76Ashadh 2080Ashadh 2081Change (Rs. in Million)Average Industry (Ashadh 2080)Average Industry (Ashadh 2081)Percentage Change (%)GlobalNabilNIMBParbhuHBLLaxmiSunriseKumariNIC AsiaRBBADBLNBLPrimeSBLEBLNMBSanimaCitizenSCBNLNSBIMBL-8k08k16k24k-4004080120Highcharts.com
Analysis - 4 : Net Fee and Commission Income (NFCI)
|
What Does Net Fee and Commission Income (NFCI) mean to Banks?
Net Fees and Commission Income is supplementary source of revenue in addition to Net Interest Income of the Bank consisting of charges, fees or commission on products or services offered by the Bank. Bank’s normally collect loan administration fees, renewal fees, digital banking fees, card issuance fees, remittance commission among others.
|
Net Fees and Commission Income Performance Analysis:
During the review period Nabil Bank managed to collect highest NFCI of Rs. 3,243.28 Million up by 12.04% as compared to earlier year followed by Global IME Bank with NFCI of Rs.2,676.69 Million up by 29.90% as compared to earlier year. Laxmi Sunrise Bank’s NFCI increased by hefty 94.66% during review period, thanks to its merger effect. NIC ASIA Bank, Nepal SBI Bank and Machhapuchhere Bank however encountered negative growth on NFCI with 13.88%, 4.81% and 4.93% fall respectively as compared to Ashadh 2080. In terms of lowest NFCI, Rastriya Banijye Bank collected only Rs.757.89 Million from NFCI. Average industrial growth of NFCI for Commercial Banks remained at 15.08% during the review period.
Rs. in Million
|
Bank
|
Ashadh 2080
|
Ashadh 2081
|
Change (Rs.)
|
Change%
|
Ranking
|
|
Nabil
|
2,894.79
|
3,243.28
|
348.48
|
12.04%
|
1
|
|
Global
|
2,060.57
|
2,676.69
|
616.12
|
29.90%
|
2
|
|
Kumari
|
1,513.31
|
2,117.05
|
603.75
|
39.90%
|
3
|
|
NIC Asia
|
2,322.48
|
2,000.08
|
(322.40)
|
-13.88%
|
4
|
|
LaxmiSunrise
|
983.42
|
1,914.36
|
930.94
|
94.66%
|
5
|
|
Parbhu
|
1,592.59
|
1,910.50
|
317.91
|
19.96%
|
6
|
|
NIMB
|
1,601.35
|
1,780.19
|
178.83
|
11.17%
|
7
|
|
NMB
|
1,546.86
|
1,674.40
|
127.54
|
8.24%
|
8
|
|
Prime
|
1,176.23
|
1,546.14
|
369.91
|
31.45%
|
9
|
|
ADBL
|
1,158.21
|
1,428.28
|
270.07
|
23.32%
|
10
|
|
SCBNL
|
1,283.93
|
1,415.78
|
131.85
|
10.27%
|
11
|
|
SBL
|
1,345.62
|
1,391.81
|
46.19
|
3.43%
|
12
|
|
EBL
|
1,075.59
|
1,343.22
|
267.62
|
24.88%
|
13
|
|
NBL
|
831.07
|
1,222.91
|
391.84
|
47.15%
|
14
|
|
NSBI
|
1,188.00
|
1,130.81
|
(57.19)
|
-4.81%
|
15
|
|
Citizen
|
876.78
|
1,124.98
|
248.19
|
28.31%
|
16
|
|
MBL
|
1,144.04
|
1,087.63
|
(56.42)
|
-4.93%
|
17
|
|
HBL
|
967.09
|
1,040.45
|
73.36
|
7.59%
|
18
|
|
Sanima
|
797.70
|
1,018.34
|
220.64
|
27.66%
|
19
|
|
RBB
|
664.50
|
757.89
|
93.40
|
14.05%
|
20
|
|
Average industry
|
1,351.21
|
1,591.24
|
240.03
|
15.08%
|
|
Created with Highcharts 11.4.8BanksNet Fees and Commission Income(Rs. inMillion)Percentage Change (%)Net Fees and Commission Income Performance Analysis2 894.792 894.792 060.572 060.571 513.311 513.312 322.482 322.48983.42983.421 592.591 592.591 601.351 601.351 546.861 546.861 176.231 176.231 158.211 158.211 283.931 283.931 345.621 345.621 075.591 075.59831.07831.071 1881 188876.78876.781 144.041 144.04967.09967.09797.7797.7664.5664.53 243.283 243.282 676.692 676.692 117.052 117.052 000.082 000.081 914.361 914.361 910.51 910.51 780.191 780.191 674.41 674.41 546.141 546.141 428.281 428.281 415.781 415.781 391.811 391.811 343.221 343.221 222.911 222.911 130.811 130.811 124.981 124.981 087.631 087.631 040.451 040.451 018.341 018.34757.89757.89348.48348.48616.12616.12603.75603.75-322.4-322.4930.94930.94317.91317.91178.83178.83127.54127.54369.91369.91270.07270.07131.85131.8546.1946.19267.62267.62391.84391.84-57.19-57.19248.19248.19-56.42-56.4273.3673.36220.64220.6493.493.41 351.20651 351.20651 351.20651 351.20651 351.20651 351.20651 351.20651 351.20651 351.20651 351.20651 351.20651 351.20651 351.20651 351.20651 351.20651 351.20651 351.20651 351.20651 351.20651 351.20651 351.20651 351.20651 351.20651 351.20651 351.20651 351.20651 351.20651 351.20651 351.20651 351.20651 351.20651 351.20651 351.20651 351.20651 351.20651 351.20651 351.20651 351.20651 351.20651 351.20651 591.23951 591.23951 591.23951 591.23951 591.23951 591.23951 591.23951 591.23951 591.23951 591.23951 591.23951 591.23951 591.23951 591.23951 591.23951 591.23951 591.23951 591.23951 591.23951 591.23951 591.23951 591.23951 591.23951 591.23951 591.23951 591.23951 591.23951 591.23951 591.23951 591.23951 591.23951 591.23951 591.23951 591.23951 591.23951 591.23951 591.23951 591.23951 591.23951 591.239512.0412.0429.929.939.939.9-13.88-13.8894.6694.6619.9619.9611.1711.178.248.2431.4531.4523.3223.3210.2710.273.433.4324.8824.8847.1547.15-4.81-4.8128.3128.31-4.93-4.937.597.5927.6627.6614.0514.05Ashadh 2080Ashadh 2081Change (Rs. in Million)Average Industry (Ashadh 2080)Average Industry (Ashadh 2081)Percentage Change (%)NabilGlobalKumariNIC AsiaLaxmiSunriseParbhuNIMBNMBPrimeADBLSCBNLSBLEBLNBLNSBICitizenMBLHBLSanimaRBB-1.2k01.2k2.4k3.6k-4004080120Highcharts.com
Analysis - 5 : Impairment Charges
|
What Does Impairment Charges mean to Banks?Impairment Charges are charges recognized as expenses by Banks when Bank expects that they will not recover full amount of expected cash flows of loans. Impairment Charges are reversed if the expected cash flows are lateral realized. Banks try to minimize their Impairment Charges to increase their profitability through stronger recovery actions.
|
Impairment Charges Performance Analysis:
Impairment charges of overall industry decreased by 35.96% on average during the review period. Impairment Charges of Rastriya Banijye Bank decreased by hefty Rs.2,68 Billion i.e. by 102.87% as compared to Ashadh 2080. RBB has the impairment reversal of Rs.74.95 Million during Ashadh 2081. Standard Chartered Bank Nepal has the second lowest impairment charges whose impairment charges decreased by 63.88% as on Ashadh 2081. Global IME Bank has the highest impairment charges of Rs.3743.30 Million followed by Kumari Bank with Rs.3,564.28 Million of impairment charges. Highest Year-on-Year growth on impairment charges was reported by NIC ASIA Bank with massive 293.97% increment from Rs.721.96 Million to Rs.2844.33 Million. Laxmi Sunrise Bank also reported increase by 222.34% on its impairment charges from Rs.1060.7 Million to Rs.3419.05 Million.
Rs. in Million
|
Bank
|
Ashadh 2080
|
Ashadh 2081
|
Change (Rs.)
|
Change%
|
Ranking
|
|
RBB
|
2,608.61
|
(74.95)
|
(2,683.55)
|
-102.87%
|
1
|
|
SCBNL
|
598.25
|
216.11
|
(382.13)
|
-63.88%
|
2
|
|
EBL
|
771.36
|
282.40
|
(488.96)
|
-63.39%
|
3
|
|
Parbhu
|
5,210.17
|
556.81
|
(4,653.36)
|
-89.31%
|
4
|
|
NSBI
|
1,511.19
|
636.39
|
(874.80)
|
-57.89%
|
5
|
|
MBL
|
1,148.26
|
1,072.20
|
(76.06)
|
-6.62%
|
6
|
|
SBL
|
1,187.56
|
1,231.69
|
44.13
|
3.72%
|
7
|
|
ADBL
|
1,458.17
|
1,233.61
|
(224.56)
|
-15.40%
|
8
|
|
Prime
|
4,106.19
|
1,243.85
|
(2,862.34)
|
-69.71%
|
9
|
|
Sanima
|
1,053.11
|
1,494.37
|
441.27
|
41.90%
|
10
|
|
Citizen
|
1,216.48
|
1,765.22
|
548.74
|
45.11%
|
11
|
|
NMB
|
1,453.82
|
1,921.08
|
467.26
|
32.14%
|
12
|
|
NBL
|
1,113.35
|
2,596.68
|
1,483.33
|
133.23%
|
13
|
|
HBL
|
4,868.93
|
2,786.82
|
(2,082.11)
|
-42.76%
|
14
|
|
NIC Asia
|
721.96
|
2,844.33
|
2,122.36
|
293.97%
|
15
|
|
NIMB
|
3,200.30
|
3,205.64
|
5.34
|
0.17%
|
16
|
|
Nabil
|
5,426.27
|
3,224.39
|
(2,201.88)
|
-40.58%
|
17
|
|
LaxmiSunrise
|
1,060.70
|
3,419.05
|
2,358.35
|
222.34%
|
18
|
|
Kumari
|
8,115.80
|
3,564.28
|
(4,551.52)
|
-56.08%
|
19
|
|
Global
|
3,426.14
|
3,743.30
|
317.16
|
9.26%
|
20
|
|
Average industry
|
2,512.83
|
1,848.16
|
(664.67)
|
-35.96%
|
|
Created with Highcharts 11.4.8BanksImpairment Charges(Rs. in Million)Percentage Change (%)Impairment Charges Performance Analysis2 608.612 608.61598.25598.25771.36771.365 210.175 210.171 511.191 511.191 148.261 148.261 187.561 187.561 458.171 458.174 106.194 106.191 053.111 053.111 216.481 216.481 453.821 453.821 113.351 113.354 868.934 868.93721.96721.963 200.33 200.35 426.275 426.271 060.71 060.78 115.88 115.83 426.143 426.14-74.95-74.95216.11216.11282.4282.4556.81556.81636.39636.391 072.21 072.21 231.691 231.691 233.611 233.611 243.851 243.851 494.371 494.371 765.221 765.221 921.081 921.082 596.682 596.682 786.822 786.822 844.332 844.333 205.643 205.643 224.393 224.393 419.053 419.053 564.283 564.283 743.33 743.3-2 683.55-2 683.55-382.13-382.13-488.96-488.96-4 653.36-4 653.36-874.8-874.8-76.06-76.0644.1344.13-224.56-224.56-2 862.34-2 862.34441.27441.27548.74548.74467.26467.261 483.331 483.33-2 082.11-2 082.112 122.362 122.365.345.34-2 201.88-2 201.882 358.352 358.35-4 551.52-4 551.52317.16317.162 512.8312 512.8312 512.8312 512.8312 512.8312 512.8312 512.8312 512.8312 512.8312 512.8312 512.8312 512.8312 512.8312 512.8312 512.8312 512.8312 512.8312 512.8312 512.8312 512.8312 512.8312 512.8312 512.8312 512.8312 512.8312 512.8312 512.8312 512.8312 512.8312 512.8312 512.8312 512.8312 512.8312 512.8312 512.8312 512.8312 512.8312 512.8312 512.8312 512.8311 848.16351 848.16351 848.16351 848.16351 848.16351 848.16351 848.16351 848.16351 848.16351 848.16351 848.16351 848.16351 848.16351 848.16351 848.16351 848.16351 848.16351 848.16351 848.16351 848.16351 848.16351 848.16351 848.16351 848.16351 848.16351 848.16351 848.16351 848.16351 848.16351 848.16351 848.16351 848.16351 848.16351 848.16351 848.16351 848.16351 848.16351 848.16351 848.16351 848.1635-102.87-102.87-63.88-63.88-63.39-63.39-89.31-89.31-57.89-57.89-6.62-6.623.723.72-15.4-15.4-69.71-69.7141.941.945.1145.1132.1432.14133.23133.23-42.76-42.76293.97293.970.170.17-40.58-40.58222.34222.34-56.08-56.089.269.26Ashadh 2080Ashadh 2081Change (Rs. in Million)Average Industry (Ashadh 2080)Average Industry (Ashadh 2081)Percentage Change (%)RBBSCBNLEBLParbhuNSBIMBLSBLADBLPrimeSanimaCitizenNMBNBLHBLNIC AsiaNIMBNabilLaxmiSunriseKumariGlobal-10k-5k05k10k-1500150300450Highcharts.com
Analysis - 6 : Personnel Expenses (Excluding Bonus)
|
What Does Personnel Expenses mean to Banks?
Personnel expenses includes expenses related to employees of the Bank. Personnel Expenses mostly include staff’s salary, allowances, pension, gratuity, contribution to provident fund, training expenses, uniform expenses, insurance, staff bonus, finance expense under NFRS etc. Banks are required to create provision for staff bonus which is a mandatory requirement under the requirement of the Bonus Act, 2074. Amount of bonus is not included here under analysis.
|
Personnel Expenses (Excluding Bonus) Performance Analysis:
Standard Chartered Bank seems to have well managed its Personnel expenses with lowest Personal Expenses as on Ashadh 2081 of 1,061.37 Million followed by Sanima Bank with 1504.41 Million. Highest personnel expense was reported by NIC ASIA with Rs.4,217.33 Million followed by Rastriye Banijye Bank with Rs.4,103.43 Million. In terms of highest Y-o-Y growth, Laxmi Sunrise Bank’s personnel expenses excluding bonus increased by 144.54% followed by Kumari Bank with 89.14% increment. Overall Industry’s average personnel expenses remained at Rs. 2780.19 Million up by 426.39 Million with increment of 15.34% y-o-y.
Rs. in Million
|
Bank
|
Ashadh 2080
|
Ashadh 2081
|
Change (Rs.)
|
Change%
|
Ranking
|
|
SCBNL
|
991.72
|
1,061.37
|
69.65
|
7.02%
|
1
|
|
Sanima
|
1,347.56
|
1,504.41
|
156.86
|
11.64%
|
2
|
|
Prime
|
1,380.25
|
1,524.75
|
144.50
|
10.47%
|
3
|
|
NSBI
|
1,661.67
|
1,641.53
|
(20.14)
|
-1.21%
|
4
|
|
Citizen
|
1,610.29
|
1,649.60
|
39.31
|
2.44%
|
5
|
|
EBL
|
1,594.79
|
1,663.01
|
68.23
|
4.28%
|
6
|
|
MBL
|
1,861.06
|
1,901.59
|
40.54
|
2.18%
|
7
|
|
NMB
|
2,177.05
|
2,270.58
|
93.54
|
4.30%
|
8
|
|
SBL
|
2,344.98
|
2,450.67
|
105.69
|
4.51%
|
9
|
|
HBL
|
1,841.03
|
2,748.92
|
907.89
|
49.31%
|
10
|
|
NIMB
|
2,443.29
|
3,062.09
|
618.80
|
25.33%
|
11
|
|
ADBL
|
3,274.63
|
3,197.73
|
(76.90)
|
-2.35%
|
12
|
|
NBL
|
3,395.34
|
3,419.52
|
24.18
|
0.71%
|
13
|
|
Nabil
|
3,493.85
|
3,677.88
|
184.03
|
5.27%
|
14
|
|
Global
|
3,204.92
|
3,774.16
|
569.24
|
17.76%
|
15
|
|
LaxmiSunrise
|
1,545.83
|
3,780.21
|
2,234.37
|
144.54%
|
16
|
|
Kumari
|
2,098.53
|
3,969.06
|
1,870.54
|
89.14%
|
17
|
|
Parbhu
|
3,130.34
|
3,985.93
|
855.59
|
27.33%
|
18
|
|
RBB
|
3,403.12
|
4,103.43
|
700.31
|
20.58%
|
19
|
|
NIC Asia
|
4,275.72
|
4,217.33
|
(58.39)
|
-1.37%
|
20
|
|
Average industry
|
2,353.80
|
2,780.19
|
426.39
|
15.34%
|
|
Created with Highcharts 11.4.8BanksPersonnel Expenses (Excluding Bonus)(Rs.in Million)Percentage Change (%)Personnel Expenses (Excluding Bonus) Analysis991.72991.721 347.561 347.561 380.251 380.251 661.671 661.671 610.291 610.291 594.791 594.791 861.061 861.062 177.052 177.052 344.982 344.981 841.031 841.032 443.292 443.293 274.633 274.633 395.343 395.343 493.853 493.853 204.923 204.921 545.831 545.832 098.532 098.533 130.343 130.343 403.123 403.124 275.724 275.721 061.371 061.371 504.411 504.411 524.751 524.751 641.531 641.531 649.61 649.61 663.011 663.011 901.591 901.592 270.582 270.582 450.672 450.672 748.922 748.923 062.093 062.093 197.733 197.733 419.523 419.523 677.883 677.883 774.163 774.163 780.213 780.213 969.063 969.063 985.933 985.934 103.434 103.434 217.334 217.3369.6569.65156.86156.86144.5144.5-20.14-20.1439.3139.3168.2368.2340.5440.5493.5493.54105.69105.69907.89907.89618.8618.8-76.9-76.924.1824.18184.03184.03569.24569.242 234.372 234.371 870.541 870.54855.59855.59700.31700.31-58.39-58.392 353.79852 353.79852 353.79852 353.79852 353.79852 353.79852 353.79852 353.79852 353.79852 353.79852 353.79852 353.79852 353.79852 353.79852 353.79852 353.79852 353.79852 353.79852 353.79852 353.79852 353.79852 353.79852 353.79852 353.79852 353.79852 353.79852 353.79852 353.79852 353.79852 353.79852 353.79852 353.79852 353.79852 353.79852 353.79852 353.79852 353.79852 353.79852 353.79852 353.79852 780.18852 780.18852 780.18852 780.18852 780.18852 780.18852 780.18852 780.18852 780.18852 780.18852 780.18852 780.18852 780.18852 780.18852 780.18852 780.18852 780.18852 780.18852 780.18852 780.18852 780.18852 780.18852 780.18852 780.18852 780.18852 780.18852 780.18852 780.18852 780.18852 780.18852 780.18852 780.18852 780.18852 780.18852 780.18852 780.18852 780.18852 780.18852 780.18852 780.18857.027.0211.6411.6410.4710.47-1.21-1.212.442.444.284.282.182.184.34.34.514.5149.3149.3125.3325.33-2.35-2.350.710.715.275.2717.7617.76144.54144.5489.1489.1427.3327.3320.5820.58-1.37-1.37Ashadh 2080Ashadh 2081Change (Rs. in Million)Average Industry (Ashadh 2080)Average Industry (Ashadh 2081)Percentage Change (%)SCBNLSanimaPrimeNSBICitizenEBLMBLNMBSBLHBLNIMBADBLNBLNabilGlobalLaxmiSunriseKumariParbhuRBBNIC Asia-1.5k01.5k3k4.5k-60060120180Highcharts.com
Per branch staff expenses (Excluding bonus) Performance Analysis
Prime Commercial Bank seems to have best managed its per branch staff expenses with lowest per branch expenses of Rs.7.82 Million, followed by Citizen’s Bank with Rs.8.25 Million. Some of the Banks like ADBL, NIC ASIA and Nepal SBI Bank managed to reduce its per branch staff expenses excluding bonus by 2.35%, 1.37%, and 1.21% respectively. In terms of highest per branch staff expenses, Standard Chartered Bank Nepal has the highest per branch staff expenses of Rs.70.76 Million followed by Himalayan Bank with Rs.14.10 Million. Average Per branch staff expenses increase by 12.05% on Y-o-Y basis.
Rs. in Million
|
Bank
|
Ashadh 2080
|
Ashadh 2081
|
Change (Rs.)
|
Change%
|
Ranking
|
|
Prime
|
7.08
|
7.82
|
0.74
|
10.47%
|
1
|
|
Citizen
|
8.05
|
8.25
|
0.20
|
2.44%
|
2
|
|
Global
|
7.37
|
8.68
|
1.31
|
17.76%
|
3
|
|
NIC Asia
|
8.91
|
8.79
|
(0.12)
|
-1.37%
|
4
|
|
NIMB
|
7.19
|
9.01
|
1.82
|
25.33%
|
5
|
|
Parbhu
|
8.03
|
10.22
|
2.19
|
27.33%
|
6
|
|
MBL
|
10.34
|
10.56
|
0.23
|
2.18%
|
7
|
|
NMB
|
10.37
|
10.81
|
0.45
|
4.30%
|
8
|
|
ADBL
|
11.29
|
11.03
|
(0.27)
|
-2.35%
|
9
|
|
Sanima
|
9.98
|
11.14
|
1.16
|
11.64%
|
10
|
|
Kumari
|
6.00
|
11.34
|
5.34
|
89.14%
|
11
|
|
RBB
|
9.59
|
11.56
|
1.97
|
20.58%
|
12
|
|
NBL
|
11.71
|
11.79
|
0.08
|
0.71%
|
13
|
|
SBL
|
11.72
|
12.25
|
0.53
|
4.51%
|
14
|
|
EBL
|
11.81
|
12.32
|
0.51
|
4.28%
|
15
|
|
Nabil
|
12.05
|
12.68
|
0.63
|
5.27%
|
16
|
|
LaxmiSunrise
|
5.42
|
13.26
|
7.84
|
144.54%
|
17
|
|
NSBI
|
13.85
|
13.68
|
(0.17)
|
-1.21%
|
18
|
|
HBL
|
9.44
|
14.10
|
4.66
|
49.31%
|
19
|
|
SCBNL
|
66.11
|
70.76
|
4.64
|
7.02%
|
20
|
|
Average industry
|
12.32
|
14.00
|
1.69
|
12.05%
|
|
Created with Highcharts 11.4.8BanksPer Branch Staff Expenses(Rs. in Million)Percentage Change (%)Per Branch Staff Expenses (Excluding Bonus) Analysis7.087.088.058.057.377.378.918.917.197.198.038.0310.3410.3410.3710.3711.2911.299.989.98669.599.5911.7111.7111.7211.7211.8111.8112.0512.055.425.4213.8513.859.449.4466.1166.117.827.828.258.258.688.688.798.799.019.0110.2210.2210.5610.5610.8110.8111.0311.0311.1411.1411.3411.3411.5611.5611.7911.7912.2512.2512.3212.3212.6812.6813.2613.2613.6813.6814.114.170.7670.760.740.740.20.21.311.31-0.12-0.121.821.822.192.190.230.230.450.45-0.27-0.271.161.165.345.341.971.970.080.080.530.530.510.510.630.637.847.84-0.17-0.174.664.664.644.6412.315512.315512.315512.315512.315512.315512.315512.315512.315512.315512.315512.315512.315512.315512.315512.315512.315512.315512.315512.315512.315512.315512.315512.315512.315512.315512.315512.315512.315512.315512.315512.315512.315512.315512.315512.315512.315512.315512.315512.315514.002514.002514.002514.002514.002514.002514.002514.002514.002514.002514.002514.002514.002514.002514.002514.002514.002514.002514.002514.002514.002514.002514.002514.002514.002514.002514.002514.002514.002514.002514.002514.002514.002514.002514.002514.002514.002514.002514.002514.002510.4710.472.442.4417.7617.76-1.37-1.3725.3325.3327.3327.332.182.184.34.3-2.35-2.3511.6411.6489.1489.1420.5820.580.710.714.514.514.284.285.275.27144.54144.54-1.21-1.2149.3149.317.027.02Ashadh 2080Ashadh 2081Change (Rs. in Million)Average Industry (Ashadh 2080)Average Industry (Ashadh 2081)Percentage Change (%)PrimeCitizenGlobalNIC AsiaNIMBParbhuMBLNMBADBLSanimaKumariRBBNBLSBLEBLNabilLaxmiSunriseNSBIHBLSCBNL-250255075-60060120180Highcharts.com
Analysis - 7: Operating Expenses
|
What Does Operating Expenses mean to Banks?
Operating expenses of the Bank includes day to day operation related expenses and consists of Personnel Expenses, Depreciation and Amortization and other operating expenses of the Bank like Operating Expenses consists of Administration Expenses, Audit Fees, Lease Expenses among others.
|
Operating Expenses Performance Analysis:
Prime Commercial Bank seems to have best managed its operating expenses with lowest Operating Expenses of Rs.529.40 Million as on Ashadh 2081. Highest amount of operating expenses was reported by Global IME Bank of Rs.2256.81 Million. In terms of highest Y-o-Y growth, Operating Expenses of Laxmi Sunrise Bank increased by 97.43% as compared to previous year, majorly impacted by merger between Laxmi and Sunrise bank. Standard Chartered Bank Nepal and Nepal SBI Bank managed to decrease their operating expenses by 3.12% and 1.53% respectively during the review period. Overall Industry’s average operating expenses grew by 12.48% y-o-y.
Rs. in Million
|
Bank
|
Ashadh 2080
|
Ashadh 2081
|
Change (Rs.)
|
Change%
|
Ranking
|
|
Prime
|
527.88
|
529.40
|
1.52
|
0.29%
|
1
|
|
SCBNL
|
571.03
|
553.20
|
(17.83)
|
-3.12%
|
2
|
|
NSBI
|
701.81
|
691.04
|
(10.77)
|
-1.53%
|
3
|
|
Sanima
|
704.68
|
750.52
|
45.84
|
6.51%
|
4
|
|
MBL
|
801.94
|
820.12
|
18.18
|
2.27%
|
5
|
|
Citizen
|
901.91
|
948.75
|
46.84
|
5.19%
|
6
|
|
SBL
|
917.44
|
982.61
|
65.17
|
7.10%
|
7
|
|
ADBL
|
995.69
|
999.75
|
4.06
|
0.41%
|
8
|
|
EBL
|
736.67
|
1,039.68
|
303.01
|
41.13%
|
9
|
|
NBL
|
916.77
|
1,074.84
|
158.07
|
17.24%
|
10
|
|
Kumari
|
1,019.95
|
1,111.29
|
91.34
|
8.96%
|
11
|
|
HBL
|
1,076.99
|
1,284.29
|
207.30
|
19.25%
|
12
|
|
NMB
|
1,192.03
|
1,286.80
|
94.77
|
7.95%
|
13
|
|
RBB
|
1,165.72
|
1,339.08
|
173.36
|
14.87%
|
14
|
|
Parbhu
|
1,483.90
|
1,563.06
|
79.17
|
5.33%
|
15
|
|
NIMB
|
1,184.02
|
1,566.47
|
382.45
|
32.30%
|
16
|
|
LaxmiSunrise
|
821.75
|
1,622.41
|
800.66
|
97.43%
|
17
|
|
Nabil
|
1,528.76
|
1,685.44
|
156.68
|
10.25%
|
18
|
|
NIC Asia
|
2,026.03
|
2,060.43
|
34.39
|
1.70%
|
19
|
|
Global
|
1,875.36
|
2,256.81
|
381.45
|
20.34%
|
20
|
|
Average industry
|
1,057.52
|
1,208.30
|
150.78
|
12.48%
|
|
Created with Highcharts 11.4.8BanksOperating Expenses(Rs. in Million)Percentage Change (%)Operating Expenses Analysis527.88527.88571.03571.03701.81701.81704.68704.68801.94801.94901.91901.91917.44917.44995.69995.69736.67736.67916.77916.771 019.951 019.951 076.991 076.991 192.031 192.031 165.721 165.721 483.91 483.91 184.021 184.02821.75821.751 528.761 528.762 026.032 026.031 875.361 875.36529.4529.4553.2553.2691.04691.04750.52750.52820.12820.12948.75948.75982.61982.61999.75999.751 039.681 039.681 074.841 074.841 111.291 111.291 284.291 284.291 286.81 286.81 339.081 339.081 563.061 563.061 566.471 566.471 622.411 622.411 685.441 685.442 060.432 060.432 256.812 256.811.521.52-17.83-17.83-10.77-10.7745.8445.8418.1818.1846.8446.8465.1765.174.064.06303.01303.01158.07158.0791.3491.34207.3207.394.7794.77173.36173.3679.1779.17382.45382.45800.66800.66156.68156.6834.3934.39381.45381.451 057.51651 057.51651 057.51651 057.51651 057.51651 057.51651 057.51651 057.51651 057.51651 057.51651 057.51651 057.51651 057.51651 057.51651 057.51651 057.51651 057.51651 057.51651 057.51651 057.51651 057.51651 057.51651 057.51651 057.51651 057.51651 057.51651 057.51651 057.51651 057.51651 057.51651 057.51651 057.51651 057.51651 057.51651 057.51651 057.51651 057.51651 057.51651 057.51651 057.51651 208.29951 208.29951 208.29951 208.29951 208.29951 208.29951 208.29951 208.29951 208.29951 208.29951 208.29951 208.29951 208.29951 208.29951 208.29951 208.29951 208.29951 208.29951 208.29951 208.29951 208.29951 208.29951 208.29951 208.29951 208.29951 208.29951 208.29951 208.29951 208.29951 208.29951 208.29951 208.29951 208.29951 208.29951 208.29951 208.29951 208.29951 208.29951 208.29951 208.29950.290.29-3.12-3.12-1.53-1.536.516.512.272.275.195.197.17.10.410.4141.1341.1317.2417.248.968.9619.2519.257.957.9514.8714.875.335.3332.332.397.4397.4310.2510.251.71.720.3420.34Ashadh 2080Ashadh 2081Change (Rs. in Million)Average Industry (Ashadh 2080)Average Industry (Ashadh 2081)Percentage Change (%)PrimeSCBNLNSBISanimaMBLCitizenSBLADBLEBLNBLKumariHBLNMBRBBParbhuNIMBLaxmiSunriseNabilNIC AsiaGlobal-800080016002400-4004080120Highcharts.com
Per Branch Operating Expenses Performance Analysis:
In terms of per branch operating expenses also, Prime Commercial Bank seems to have lowest per branch operating costs of Rs. 2.71 Million followed by Kumari Bank with Rs.3.18 Million. In terms of Year-on-Year variance Nepal SBI Bank and Standard Chartered Bank Nepal were the only two banks whose per branch operating expenses has decreased as compared to earlier year by 1.53% and 3.12% respectively whereas Laxmi Sunrise Bank’s per branch operating expenses increased by hefty 97.43% during the review period due to its merger effect. Overall Industry’s average per branch operating expenses grew by 8.06% y-o-y.
Rs. in Million
|
Bank
|
Ashadh 2080
|
Ashadh 2081
|
Change (Rs.)
|
Change%
|
Ranking
|
|
Prime
|
2.71
|
2.71
|
0.01
|
0.29%
|
1
|
|
Kumari
|
2.91
|
3.18
|
0.26
|
8.96%
|
2
|
|
ADBL
|
3.43
|
3.45
|
0.01
|
0.41%
|
3
|
|
NBL
|
3.16
|
3.71
|
0.55
|
17.24%
|
4
|
|
RBB
|
3.28
|
3.77
|
0.49
|
14.87%
|
5
|
|
Parbhu
|
3.80
|
4.01
|
0.20
|
5.33%
|
6
|
|
NIC Asia
|
4.22
|
4.29
|
0.07
|
1.70%
|
7
|
|
MBL
|
4.46
|
4.56
|
0.10
|
2.27%
|
8
|
|
NIMB
|
3.48
|
4.61
|
1.12
|
32.30%
|
9
|
|
Citizen
|
4.51
|
4.74
|
0.23
|
5.19%
|
10
|
|
SBL
|
4.59
|
4.91
|
0.33
|
7.10%
|
11
|
|
Global
|
4.31
|
5.19
|
0.88
|
20.34%
|
12
|
|
Sanima
|
5.22
|
5.56
|
0.34
|
6.51%
|
13
|
|
LaxmiSunrise
|
2.88
|
5.69
|
2.81
|
97.43%
|
14
|
|
NSBI
|
5.85
|
5.76
|
(0.09)
|
-1.53%
|
15
|
|
Nabil
|
5.27
|
5.81
|
0.54
|
10.25%
|
16
|
|
NMB
|
5.68
|
6.13
|
0.45
|
7.95%
|
17
|
|
HBL
|
5.52
|
6.59
|
1.06
|
19.25%
|
18
|
|
EBL
|
5.46
|
7.70
|
2.24
|
41.13%
|
19
|
|
SCBNL
|
38.07
|
36.88
|
(1.19)
|
-3.12%
|
20
|
|
Average industry
|
5.94
|
6.46
|
0.52
|
8.06%
|
|
Created with Highcharts 11.4.8BanksPer Branch Operating Expenses (Rs. inMillion)Percentage Change (%)Per Branch Operating Expenses Analysis2.712.712.912.913.433.433.163.163.283.283.83.84.224.224.464.463.483.484.514.514.594.594.314.315.225.222.882.885.855.855.275.275.685.685.525.525.465.4638.0738.072.712.713.183.183.453.453.713.713.773.774.014.014.294.294.564.564.614.614.744.744.914.915.195.195.565.565.695.695.765.765.815.816.136.136.596.597.77.736.8836.880.010.010.260.260.010.010.550.550.490.490.20.20.070.070.10.11.121.120.230.230.330.330.880.880.340.342.812.81-0.09-0.090.540.540.450.451.061.062.242.24-1.19-1.195.94055.94055.94055.94055.94055.94055.94055.94055.94055.94055.94055.94055.94055.94055.94055.94055.94055.94055.94055.94055.94055.94055.94055.94055.94055.94055.94055.94055.94055.94055.94055.94055.94055.94055.94055.94055.94055.94055.94055.94056.46256.46256.46256.46256.46256.46256.46256.46256.46256.46256.46256.46256.46256.46256.46256.46256.46256.46256.46256.46256.46256.46256.46256.46256.46256.46256.46256.46256.46256.46256.46256.46256.46256.46256.46256.46256.46256.46256.46256.46250.290.298.968.960.410.4117.2417.2414.8714.875.335.331.71.72.272.2732.332.35.195.197.17.120.3420.346.516.5197.4397.43-1.53-1.5310.2510.257.957.9519.2519.2541.1341.13-3.12-3.12Ashadh 2080Ashadh 2081Change (Rs. in Million)Average Industry (Ashadh 2080)Average Industry (Ashadh 2081)Percentage Change (%)PrimeKumariADBLNBLRBBParbhuNIC AsiaMBLNIMBCitizenSBLGlobalSanimaLaxmiSunriseNSBINabilNMBHBLEBLSCBNL-150153045-4004080120Highcharts.com
Analysis - 8: Loan Write-offs
|
What Does Loan Write-offs mean to Banks?
Loans are written off by the Banks when Bank’s consider loans to be uncollectable even after necessary recovery efforts from the Bank. Written off loans are removed from Bank’s Balance Sheet and are booked as expenses under non-operating expenses of the Bank reducing Bank’s profit.
|
Loan Write-offs Performance Analysis:
During the review period Nepal Bank and Nepal SBI Bank have not written-offs any loans whereas highest value of loan was written-off by Himalayan Bank Limited of Rs.1,124.35 Million followed by NIC ASIA Bank with written off loan of Rs.1097.30 Million. In terms of Y-o-Y comparison Prime Commercial Bank’s write-off expenses surged by 270.04%. Overall Industry’s average Loan Write-off expenses decreased by 2.69% y-o-y.
Rs. in Million
|
Bank
|
Ashadh 2080
|
Ashadh 2081
|
Change (Rs.)
|
Change%
|
Ranking
|
|
HBL
|
1,070.45
|
1,124.35
|
53.90
|
5.04%
|
1
|
|
NIC Asia
|
377.89
|
1,097.30
|
719.41
|
190.37%
|
2
|
|
NIMB
|
1,300.82
|
732.10
|
(568.72)
|
-43.72%
|
3
|
|
LaxmiSunrise
|
240.38
|
294.56
|
54.18
|
22.54%
|
4
|
|
Prime
|
72.08
|
266.71
|
194.63
|
270.04%
|
5
|
|
Global
|
273.50
|
183.68
|
(89.82)
|
-32.84%
|
6
|
|
NMB
|
76.15
|
166.29
|
90.15
|
118.38%
|
7
|
|
MBL
|
54.23
|
97.37
|
43.14
|
79.55%
|
8
|
|
Sanima
|
54.99
|
95.96
|
40.97
|
74.51%
|
9
|
|
Nabil
|
274.88
|
89.74
|
(185.14)
|
-67.35%
|
10
|
|
SCBNL
|
19.54
|
26.39
|
6.85
|
35.05%
|
11
|
|
Kumari
|
13.76
|
21.71
|
7.95
|
57.82%
|
12
|
|
SBL
|
101.19
|
20.26
|
(80.93)
|
-79.98%
|
13
|
|
Citizen
|
79.57
|
19.52
|
(60.05)
|
-75.47%
|
14
|
|
RBB
|
-
|
6.72
|
6.72
|
0.00%
|
15
|
|
Parbhu
|
157.09
|
3.00
|
(154.09)
|
-98.09%
|
16
|
|
EBL
|
1.29
|
2.23
|
0.94
|
73.17%
|
17
|
|
ADBL
|
26.37
|
0.05
|
(26.32)
|
-99.81%
|
18
|
|
NBL
|
-
|
-
|
-
|
0.00%
|
19
|
|
NSBI
|
-
|
-
|
-
|
0.00%
|
20
|
|
Average industry
|
209.71
|
212.40
|
2.69
|
1.27%
|
|
Created with Highcharts 11.4.8BanksLoan Write-offs (Rs. in Million)Percentage Change (%)Loan Write-offs Performance Analysis1 070.451 070.45377.89377.891 300.821 300.82240.38240.3872.0872.08273.5273.576.1576.1554.2354.2354.9954.99274.88274.8819.5419.5413.7613.76101.19101.1979.5779.5700157.09157.091.291.2926.3726.3700001 124.351 124.351 097.31 097.3732.1732.1294.56294.56266.71266.71183.68183.68166.29166.2997.3797.3795.9695.9689.7489.7426.3926.3921.7121.7120.2620.2619.5219.526.726.72332.232.230.050.05000053.953.9719.41719.41-568.72-568.7254.1854.18194.63194.63-89.82-89.8290.1590.1543.1443.1440.9740.97-185.14-185.146.856.857.957.95-80.93-80.93-60.05-60.056.726.72-154.09-154.090.940.94-26.32-26.320000209.709209.709209.709209.709209.709209.709209.709209.709209.709209.709209.709209.709209.709209.709209.709209.709209.709209.709209.709209.709209.709209.709209.709209.709209.709209.709209.709209.709209.709209.709209.709209.709209.709209.709209.709209.709209.709209.709209.709209.709212.397212.397212.397212.397212.397212.397212.397212.397212.397212.397212.397212.397212.397212.397212.397212.397212.397212.397212.397212.397212.397212.397212.397212.397212.397212.397212.397212.397212.397212.397212.397212.397212.397212.397212.397212.397212.397212.397212.397212.3975.045.04190.37190.37-43.72-43.7222.5422.54270.04270.04-32.84-32.84118.38118.3879.5579.5574.5174.51-67.35-67.3535.0535.0557.8257.82-79.98-79.98-75.47-75.4700-98.09-98.0973.1773.17-99.81-99.810000Ashadh 2080Ashadh 2081Change (Rs. in Million)Average Industry (Ashadh 2080)Average Industry (Ashadh 2081)Percentage Change (%)HBLNIC AsiaNIMBLaxmiSunrisePrimeGlobalNMBMBLSanimaNabilSCBNLKumariSBLCitizenRBBParbhuEBLADBLNBLNSBI-1600-80008001600-1200120240360Highcharts.com
Analysis - 9 : Net Profit After Tax (NPAT)
|
What Does Net Profit After Tax (NPAT) mean to Banks?
Net Profit After Tax (NPAT) means the final profit after deduction of all the expenses and taxes of the Bank. Net Profit helps to judge the profitability healthiness of the Bank. Higher the NPAT better is the bank’s performance in terms of return to shareholders.
|
Net Profit After Tax Performance Analysis:
Average Net Profit After Tax of overall commercial banks grew at 11.81% Y-o-Y. Nabil Bank reported highest net profit as on Ashadh 2081 with Rs.7,060.03 Million followed by Global IME Bank with Rs.6,016.22 Million. Highest Y-o-Y increase in Net Profit was reported by Prabhu Bank with 1499.03% increment in Net Profit thanks to its impairment reversal by Rs.4.65 Billion. Prabhu Bank is followed by Kumari Bank with 345.67% Y-o-Y increment whose impairment charges were reversed by Rs.4.55 Billion. In terms of negative growth, NPAT of NIC ASIA decreased by 68.91% and remained at Rs.1381.87 Million. Lowest Net profit was reported by Machhapuchhere Bank with net profit of Rs. 1250.17 Million.
Rs. in Million
|
Bank
|
Ashadh 2080
|
Ashadh 2081
|
Change (Rs.)
|
Change%
|
Ranking
|
|
Nabil
|
6,404.94
|
7,060.03
|
655.10
|
10.23%
|
1
|
|
Global
|
6,694.36
|
6,016.22
|
(678.14)
|
-10.13%
|
2
|
|
NIMB
|
3,720.83
|
5,198.32
|
1,477.49
|
39.71%
|
3
|
|
Parbhu
|
280.22
|
4,480.81
|
4,200.59
|
1499.03%
|
4
|
|
Prime
|
1,027.90
|
3,774.30
|
2,746.40
|
267.19%
|
5
|
|
EBL
|
3,362.12
|
3,700.65
|
338.53
|
10.07%
|
6
|
|
ADBL
|
1,323.41
|
3,655.66
|
2,332.25
|
176.23%
|
7
|
|
RBB
|
3,595.13
|
3,398.21
|
(196.92)
|
-5.48%
|
8
|
|
SCBNL
|
3,465.33
|
3,308.95
|
(156.38)
|
-4.51%
|
9
|
|
LaxmiSunrise
|
2,285.24
|
3,034.54
|
749.30
|
32.79%
|
10
|
|
SBL
|
3,166.77
|
3,015.54
|
(151.24)
|
-4.78%
|
11
|
|
HBL
|
1,562.82
|
2,838.05
|
1,275.23
|
81.60%
|
12
|
|
Sanima
|
2,605.79
|
2,381.94
|
(223.85)
|
-8.59%
|
13
|
|
NMB
|
3,222.55
|
2,336.60
|
(885.95)
|
-27.49%
|
14
|
|
Kumari
|
517.92
|
2,308.21
|
1,790.29
|
345.67%
|
15
|
|
NSBI
|
1,967.51
|
2,013.72
|
46.21
|
2.35%
|
16
|
|
NBL
|
3,437.58
|
1,656.83
|
(1,780.75)
|
-51.80%
|
17
|
|
NIC Asia
|
4,444.77
|
1,381.87
|
(3,062.90)
|
-68.91%
|
18
|
|
Citizen
|
1,863.76
|
1,342.47
|
(521.29)
|
-27.97%
|
19
|
|
MBL
|
1,625.53
|
1,250.17
|
(375.36)
|
-23.09%
|
20
|
|
Average industry
|
2,828.72
|
3,207.65
|
378.93
|
11.81%
|
|
Created with Highcharts 11.4.8BanksNPAT (Rs. in Million)Percentage Change (%)Net Profit After Tax (NPAT) Performance Analysis6 404.946 404.946 694.366 694.363 720.833 720.83280.22280.221 027.91 027.93 362.123 362.121 323.411 323.413 595.133 595.133 465.333 465.332 285.242 285.243 166.773 166.771 562.821 562.822 605.792 605.793 222.553 222.55517.92517.921 967.511 967.513 437.583 437.584 444.774 444.771 863.761 863.761 625.531 625.537 060.037 060.036 016.226 016.225 198.325 198.324 480.814 480.813 774.33 774.33 700.653 700.653 655.663 655.663 398.213 398.213 308.953 308.953 034.543 034.543 015.543 015.542 838.052 838.052 381.942 381.942 336.62 336.62 308.212 308.212 013.722 013.721 656.831 656.831 381.871 381.871 342.471 342.471 250.171 250.17655.1655.1-678.14-678.141 477.491 477.494 200.594 200.592 746.42 746.4338.53338.532 332.252 332.25-196.92-196.92-156.38-156.38749.3749.3-151.24-151.241 275.231 275.23-223.85-223.85-885.95-885.951 790.291 790.2946.2146.21-1 780.75-1 780.75-3 062.9-3 062.9-521.29-521.29-375.36-375.362 828.7242 828.7242 828.7242 828.7242 828.7242 828.7242 828.7242 828.7242 828.7242 828.7242 828.7242 828.7242 828.7242 828.7242 828.7242 828.7242 828.7242 828.7242 828.7242 828.7242 828.7242 828.7242 828.7242 828.7242 828.7242 828.7242 828.7242 828.7242 828.7242 828.7242 828.7242 828.7242 828.7242 828.7242 828.7242 828.7242 828.7242 828.7242 828.7242 828.7243 207.65453 207.65453 207.65453 207.65453 207.65453 207.65453 207.65453 207.65453 207.65453 207.65453 207.65453 207.65453 207.65453 207.65453 207.65453 207.65453 207.65453 207.65453 207.65453 207.65453 207.65453 207.65453 207.65453 207.65453 207.65453 207.65453 207.65453 207.65453 207.65453 207.65453 207.65453 207.65453 207.65453 207.65453 207.65453 207.65453 207.65453 207.65453 207.65453 207.654510.2310.23-10.13-10.1339.7139.711 499.031 499.03267.19267.1910.0710.07176.23176.23-5.48-5.48-4.51-4.5132.7932.79-4.78-4.7881.681.6-8.59-8.59-27.49-27.49345.67345.672.352.35-51.8-51.8-68.91-68.91-27.97-27.97-23.09-23.09Ashadh 2080Ashadh 2081Change (Rs. in Million)Average Industry (Ashadh 2080)Average Industry (Ashadh 2081)Percentage Change (%)NabilGlobalNIMBParbhuPrimeEBLADBLRBBSCBNLLaxmiSunriseSBLHBLSanimaNMBKumariNSBINBLNIC AsiaCitizenMBL-8k-4k04k8k-600060012001800Highcharts.com
Analysis - 10 : Distributable Profit and DPS
|
What Does Distributable Profit and DPS mean to Banks?
Distributable Profit (DP) means the final profit which is available for distribution to shareholders. If the same distributable profit is divided by number of available shares with Bank then Dividend Per Share (DPS) is derived which shows how much dividend a share will generate. Higher the distributable profit and DPS better will be the Bank from Shareholders perspective.
|
Distributable Profit and DPS Performance Analysis:
Majority of commercial banks reported positive distributable profit as on Ashadh 2081 except four Banks. Nabil Bank managed to remain at top position with distributable profit of Rs.3,857.34 Million with DPS of Rs.14.26 per share followed by Everest Bank with distributable profit of Rs.3,514.47 Million with DPS of Rs.29.86 per share. Significant raise in distributable profit was reported by Nepal Bank Limited with raise in Distributable profit from Rs.0.39 Million to Rs.769.31 Million with significant recovery of previous accrued interest. NIMB, Kumari Bank, NIC ASIA and Himalayan Bank reported negative DPS of Rs.10.05, Rs.14.45, Rs.15.45 and Rs.26.71 respectively. Industrial average distributable profit remained at 381.13 Million as on Ashadh 2081.
Rs. in Million
|
Distributable Profit (Million)
|
|
Bank
|
Ashadh 2080
|
Ashadh 2081
|
Change (Rs.)
|
Change%
|
Ranking
|
|
Nabil
|
3,187.06
|
3,857.34
|
670.29
|
21.03%
|
1
|
|
EBL
|
4,110.49
|
3,514.47
|
(596.02)
|
-14.50%
|
2
|
|
ADBL
|
1,243.17
|
2,662.76
|
1,419.59
|
114.19%
|
3
|
|
SCBNL
|
2,710.56
|
2,499.17
|
(211.39)
|
-7.80%
|
4
|
|
Sanima
|
2,215.04
|
1,412.31
|
(802.73)
|
-36.24%
|
5
|
|
LaxmiSunrise
|
1,728.33
|
1,287.18
|
(441.16)
|
-25.52%
|
6
|
|
Parbhu
|
(2,236.37)
|
1,223.95
|
3,460.32
|
154.73%
|
7
|
|
Prime
|
(666.95)
|
1,199.67
|
1,866.63
|
279.87%
|
8
|
|
NSBI
|
1,070.55
|
1,130.20
|
59.65
|
5.57%
|
9
|
|
Global
|
3,243.36
|
1,104.57
|
(2,138.79)
|
-65.94%
|
10
|
|
NBL
|
0.39
|
769.31
|
768.92
|
197178.29%
|
11
|
|
Citizen
|
846.99
|
616.16
|
(230.83)
|
-27.25%
|
12
|
|
RBB
|
918.41
|
582.20
|
(336.21)
|
-36.61%
|
13
|
|
MBL
|
1,448.53
|
466.45
|
(982.08)
|
-67.80%
|
14
|
|
SBL
|
663.61
|
366.66
|
(296.95)
|
-44.75%
|
15
|
|
NMB
|
1,140.83
|
238.97
|
(901.86)
|
-79.05%
|
16
|
|
NIC Asia
|
3,534.23
|
(2,304.06)
|
(5,838.29)
|
-165.19%
|
17
|
|
NIMB
|
(3,471.72)
|
(3,430.97)
|
40.75
|
1.17%
|
18
|
|
Kumari
|
(2,202.91)
|
(3,789.00)
|
(1,586.09)
|
-72.00%
|
19
|
|
HBL
|
(3,242.63)
|
(5,784.63)
|
(2,542.01)
|
-78.39%
|
20
|
|
Average industry
|
812.05
|
381.13
|
(430.91)
|
-113.06%
|
|
Created with Highcharts 11.4.8BanksDistributable Profit(Rs. in Million)Percentage Change (%)Distributable Profit Performance Analysis3 187.063 187.064 110.494 110.491 243.171 243.172 710.562 710.562 215.042 215.041 728.331 728.33-2 236.37-2 236.37-666.95-666.951 070.551 070.553 243.363 243.360.390.39846.99846.99918.41918.411 448.531 448.53663.61663.611 140.831 140.833 534.233 534.23-3 471.72-3 471.72-2 202.91-2 202.91-3 242.63-3 242.633 857.343 857.343 514.473 514.472 662.762 662.762 499.172 499.171 412.311 412.311 287.181 287.181 223.951 223.951 199.671 199.671 130.21 130.21 104.571 104.57769.31769.31616.16616.16582.2582.2466.45466.45366.66366.66238.97238.97-2 304.06-2 304.06-3 430.97-3 430.97-3 789-3 789-5 784.63-5 784.63670.29670.29-596.02-596.021 419.591 419.59-211.39-211.39-802.73-802.73-441.16-441.163 460.323 460.321 866.631 866.6359.6559.65-2 138.79-2 138.79768.92768.92-230.83-230.83-336.21-336.21-982.08-982.08-296.95-296.95-901.86-901.86-5 838.29-5 838.2940.7540.75-1 586.09-1 586.09-2 542.01-2 542.01812.0485812.0485812.0485812.0485812.0485812.0485812.0485812.0485812.0485812.0485812.0485812.0485812.0485812.0485812.0485812.0485812.0485812.0485812.0485812.0485812.0485812.0485812.0485812.0485812.0485812.0485812.0485812.0485812.0485812.0485812.0485812.0485812.0485812.0485812.0485812.0485812.0485812.0485812.0485812.0485381.1355381.1355381.1355381.1355381.1355381.1355381.1355381.1355381.1355381.1355381.1355381.1355381.1355381.1355381.1355381.1355381.1355381.1355381.1355381.1355381.1355381.1355381.1355381.1355381.1355381.1355381.1355381.1355381.1355381.1355381.1355381.1355381.1355381.1355381.1355381.1355381.1355381.1355381.1355381.135521.0321.03-14.5-14.5114.19114.19-7.8-7.8-36.24-36.24-25.52-25.52154.73154.73279.87279.875.575.57-65.94-65.94197 178.29197 178.29-27.25-27.25-36.61-36.61-67.8-67.8-44.75-44.75-79.05-79.05-165.19-165.191.171.17-72-72-78.39-78.39Ashadh 2080Ashadh 2081Change (Rs. in Million)Average Industry (Ashadh 2080)Average Industry (Ashadh 2081)Percentage Change (%)NabilEBLADBLSCBNLSanimaLaxmiSunriseParbhuPrimeNSBIGlobalNBLCitizenRBBMBLSBLNMBNIC AsiaNIMBKumariHBL-8k-4k04k8k-80k080k160k240kHighcharts.com
|
DPS
|
|
Bank
|
Ashadh 2080
|
Ashadh 2081
|
Change (Rs.)
|
Rank
|
|
EBL
|
38.42
|
29.86
|
(8.56)
|
1
|
|
SCBNL
|
28.75
|
26.50
|
(2.24)
|
2
|
|
Nabil
|
11.78
|
14.26
|
2.48
|
3
|
|
ADBL
|
6.58
|
14.10
|
7.52
|
4
|
|
NSBI
|
10.58
|
10.76
|
0.19
|
5
|
|
Sanima
|
17.78
|
10.40
|
(7.38)
|
6
|
|
Prime
|
(3.44)
|
6.18
|
9.62
|
7
|
|
LaxmiSunrise
|
7.98
|
5.55
|
(2.42)
|
8
|
|
NBL
|
0.00
|
5.24
|
5.23
|
9
|
|
Parbhu
|
(9.50)
|
5.20
|
14.70
|
10
|
|
Citizen
|
5.96
|
4.34
|
(1.63)
|
11
|
|
MBL
|
14.12
|
4.01
|
(10.11)
|
12
|
|
RBB
|
5.87
|
3.72
|
(2.15)
|
13
|
|
Global
|
9.07
|
3.06
|
(6.01)
|
14
|
|
SBL
|
4.71
|
2.60
|
(2.11)
|
15
|
|
NMB
|
6.21
|
1.30
|
(4.91)
|
16
|
|
NIMB
|
(10.17)
|
(10.05)
|
0.12
|
17
|
|
Kumari
|
(8.40)
|
(14.45)
|
(6.05)
|
18
|
|
NIC Asia
|
30.56
|
(15.45)
|
(46.01)
|
19
|
|
HBL
|
(14.97)
|
(26.71)
|
(11.74)
|
20
|
|
Average industry
|
759.46%
|
402.18%
|
-357.28%
|
|
Created with Highcharts 11.4.8BanksDPS(Rs. in Million)Percentage Change (%)Dividend Per Share (DPS) Performance Analysis38.4238.4228.7528.7511.7811.786.586.5810.5810.5817.7817.78-3.44-3.447.987.9800-9.5-9.55.965.9614.1214.125.875.879.079.074.714.716.216.21-10.17-10.17-8.4-8.430.5630.56-14.97-14.9729.8629.8626.526.514.2614.2614.114.110.7610.7610.410.46.186.185.555.555.245.245.25.24.344.344.014.013.723.723.063.062.62.61.31.3-10.05-10.05-14.45-14.45-15.45-15.45-26.71-26.71-8.56-8.56-2.24-2.242.482.487.527.520.190.19-7.38-7.389.629.62-2.42-2.425.235.2314.714.7-1.63-1.63-10.11-10.11-2.15-2.15-6.01-6.01-2.11-2.11-4.91-4.910.120.12-6.05-6.05-46.01-46.01-11.74-11.747.59457.59457.59457.59457.59457.59457.59457.59457.59457.59457.59457.59457.59457.59457.59457.59457.59457.59457.59457.59457.59457.59457.59457.59457.59457.59457.59457.59457.59457.59457.59457.59457.59457.59457.59457.59457.59457.59457.59457.59454.0214.0214.0214.0214.0214.0214.0214.0214.0214.0214.0214.0214.0214.0214.0214.0214.0214.0214.0214.0214.0214.0214.0214.0214.0214.0214.0214.0214.0214.0214.0214.0214.0214.0214.0214.0214.0214.0214.0214.021-22.28-22.28-7.83-7.8321.0521.05114.29114.291.71.7-41.51-41.51-279.65-279.65-30.45-30.45100100-154.74-154.74-27.18-27.18-71.6-71.6-36.63-36.63-66.26-66.26-44.8-44.8-79.07-79.07-1.18-1.1872.0272.02-150.56-150.5678.4278.42Ashadh 2080Ashadh 2081Change (Rs. in Million)Average Industry (Ashadh 2080)Average Industry (Ashadh 2081)Percentage Change (%)EBLSCBNLNabilADBLNSBISanimaPrimeLaxmiSunriseNBLParbhuCitizenMBLRBBGlobalSBLNMBNIMBKumariNIC AsiaHBL-60-3003060-450-300-1500150Highcharts.com
Analysis -11: Non-Banking Assets (NBA)
|
What Does Non-Banking Assets (NBA) mean to Banks?
If a loan provided is defaulted, then Bank may sell the collateral held and recover the dues of borrower from such collateral sales. However, sometimes the collateral may not be sold and Bank may have to itself take such assets. Such assets are Non-Banking Assets to the Bank, which are shown under Investment Property under Balance Sheets.
|
Non-Banking Assets Performance Analysis:
All commercial banks have reported increase in NBA as compared to earlier year except Standard Chartered Bank Nepal which reported zero Non-Banking assets as on Ashadh 2081. Nepal Bank booked Rs.205.74 Million as Non-Banking Assets followed by Rastriye Banijye Bank with NBA of Rs.306.59 Million. Everest Bank and Nepal SBI Bank had not booked any NBA during Ashadh 2080 but both booked NBA of 324.22 Million and 522.30 Million as on Ashadh 2081. Highest amount of NBA was booked by Global IME Bank of Rs. 5040.34 Million in a year up by 190.79% as compared to earlier year. Overall Industry’s NBA increased by 49.31% during the review period.
Rs. in Million
|
Bank
|
Ashadh 2080
|
Ashadh 2081
|
Change (Rs.)
|
Change (%)
|
Ranking
|
|
SCBNL
|
-
|
-
|
-
|
-
|
1
|
|
NBL
|
198.11
|
205.74
|
7.63
|
3.85%
|
2
|
|
RBB
|
196.98
|
305.59
|
108.61
|
55.14%
|
3
|
|
NSBI
|
-
|
324.22
|
324.22
|
100%
|
4
|
|
EBL
|
-
|
522.30
|
522.30
|
100%
|
5
|
|
Sanima
|
190.17
|
674.00
|
483.83
|
254.41%
|
6
|
|
SBL
|
654.54
|
727.57
|
73.03
|
11.16%
|
7
|
|
Parbhu
|
445.35
|
783.05
|
337.69
|
75.83%
|
8
|
|
Citizen
|
256.13
|
821.26
|
565.13
|
220.64%
|
9
|
|
NMB
|
697.71
|
851.44
|
153.73
|
22.03%
|
10
|
|
ADBL
|
248.65
|
943.09
|
694.44
|
279.28%
|
11
|
|
MBL
|
609.94
|
1,201.90
|
591.97
|
97.05%
|
12
|
|
LaxmiSunrise
|
1,275.16
|
1,563.13
|
287.97
|
22.58%
|
13
|
|
Prime
|
1,413.05
|
1,911.87
|
498.82
|
35.30%
|
14
|
|
Kumari
|
1,263.21
|
1,913.18
|
649.97
|
51.45%
|
15
|
|
HBL
|
589.16
|
2,414.93
|
1,825.77
|
309.89%
|
16
|
|
Nabil
|
1,827.07
|
2,962.63
|
1,135.57
|
62.15%
|
17
|
|
NIMB
|
1,164.97
|
3,016.50
|
1,851.53
|
158.93%
|
18
|
|
NIC Asia
|
2,718.43
|
4,361.67
|
1,643.24
|
60.45%
|
19
|
|
Global
|
1,733.32
|
5,040.34
|
3,307.02
|
190.79%
|
20
|
|
Average industry
|
774.10
|
1,527.22
|
753.12
|
49.31%
|
|
Created with Highcharts 11.4.8BanksNBA (Rs. in Million)Percentage Change (%)Non-Banking Assets (NBA) Performance Analysis00198.11198.11196.98196.980000190.17190.17654.54654.54445.35445.35256.13256.13697.71697.71248.65248.65609.94609.941 275.161 275.161 413.051 413.051 263.211 263.21589.16589.161 827.071 827.071 164.971 164.972 718.432 718.431 733.321 733.3200205.74205.74305.59305.59324.22324.22522.3522.3674674727.57727.57783.05783.05821.26821.26851.44851.44943.09943.091 201.91 201.91 563.131 563.131 911.871 911.871 913.181 913.182 414.932 414.932 962.632 962.633 016.53 016.54 361.674 361.675 040.345 040.34007.637.63108.61108.61324.22324.22522.3522.3483.83483.8373.0373.03337.69337.69565.13565.13153.73153.73694.44694.44591.97591.97287.97287.97498.82498.82649.97649.971 825.771 825.771 135.571 135.571 851.531 851.531 643.241 643.243 307.023 307.02774.0975774.0975774.0975774.0975774.0975774.0975774.0975774.0975774.0975774.0975774.0975774.0975774.0975774.0975774.0975774.0975774.0975774.0975774.0975774.0975774.0975774.0975774.0975774.0975774.0975774.0975774.0975774.0975774.0975774.0975774.0975774.0975774.0975774.0975774.0975774.0975774.0975774.0975774.0975774.09751 527.22051 527.22051 527.22051 527.22051 527.22051 527.22051 527.22051 527.22051 527.22051 527.22051 527.22051 527.22051 527.22051 527.22051 527.22051 527.22051 527.22051 527.22051 527.22051 527.22051 527.22051 527.22051 527.22051 527.22051 527.22051 527.22051 527.22051 527.22051 527.22051 527.22051 527.22051 527.22051 527.22051 527.22051 527.22051 527.22051 527.22051 527.22051 527.22051 527.2205003.853.8555.1455.14100100100100254.41254.4111.1611.1675.8375.83220.64220.6422.0322.03279.28279.2897.0597.0522.5822.5835.335.351.4551.45309.89309.8962.1562.15158.93158.9360.4560.45190.79190.79Ashadh 2080Ashadh 2081Change (Rs. in Million)Average Industry (Ashadh 2080)Average Industry (Ashadh 2081)Percentage Change (%)SCBNLNBLRBBNSBIEBLSanimaSBLParbhuCitizenNMBADBLMBLLaxmiSunrisePrimeKumariHBLNabilNIMBNIC AsiaGlobal01.5k3k4.5k6k0100200300400Highcharts.com
Analysis -12: Base Rate
|
What Does Base Rate mean to Banks?
Base Rate is the floor rate upon which premium is charged by Banks to derive lending rate. Base rate consists of Cost of Fund, Cost of CRR, Cost of SLR and Operating Costs of the Bank. Higher base rate means Banks are obtaining funds at higher rate and lower base rate means banks are obtaining funds at lower rates. Higher Base rate also means expensive lending rates and lower base rate means cheaper lending rates.
|
Base Rate Performance Analysis:
During the review period Industry average base rate remained at 8.09%. As compared to earlier year, Base rate of all the commercial banks have decreased due to falling cost of deposits. Standard Chartered Bank Nepal has the lowest Base Rate of 6.60% whereas NIC ASIA Bank’s base rate of 9.19% is the highest amongst peer.
|
Bank
|
Ashadh 2080
|
Ashadh 2081
|
Change (Rs.)
|
Change%
|
Ranking
|
|
SCBNL
|
9.02%
|
6.60%
|
-2.42%
|
-26.83%
|
1
|
|
RBB
|
7.79%
|
7.01%
|
-0.78%
|
-10.01%
|
2
|
|
EBL
|
9.47%
|
7.29%
|
-2.18%
|
-23.02%
|
3
|
|
Nabil
|
9.52%
|
7.63%
|
-1.89%
|
-19.85%
|
4
|
|
NIMB
|
9.57%
|
7.82%
|
-1.75%
|
-18.29%
|
5
|
|
Sanima
|
10.15%
|
7.83%
|
-2.32%
|
-22.86%
|
6
|
|
NBL
|
9.92%
|
7.97%
|
-1.95%
|
-19.66%
|
7
|
|
Parbhu
|
10.16%
|
8.02%
|
-2.14%
|
-21.06%
|
8
|
|
ADBL
|
10.06%
|
8.09%
|
-1.97%
|
-19.58%
|
9
|
|
Global
|
10.20%
|
8.09%
|
-2.11%
|
-20.69%
|
9
|
|
SBL
|
9.91%
|
8.11%
|
-1.80%
|
-18.16%
|
11
|
|
MBL
|
10.74%
|
8.26%
|
-2.48%
|
-23.09%
|
12
|
|
Citizen
|
10.51%
|
8.26%
|
-2.25%
|
-21.41%
|
12
|
|
NSBI
|
10.74%
|
8.30%
|
-2.44%
|
-22.72%
|
14
|
|
NMB
|
10.37%
|
8.42%
|
-1.95%
|
-18.80%
|
15
|
|
Prime
|
10.57%
|
8.49%
|
-2.08%
|
-19.68%
|
16
|
|
LaxmiSunrise
|
10.75%
|
8.52%
|
-2.23%
|
-20.74%
|
17
|
|
Kumari
|
10.90%
|
8.89%
|
-2.01%
|
-18.44%
|
18
|
|
HBL
|
10.86%
|
9.08%
|
-1.78%
|
-16.39%
|
19
|
|
NIC Asia
|
9.98%
|
9.19%
|
-0.79%
|
-7.92%
|
20
|
|
Average industry
|
10.06%
|
8.09%
|
-1.97%
|
|
|
Created with Highcharts 11.4.8BanksBase Rate (Rs.)Percentage Change (%)Base Rate Performance Analysis9.029.027.797.799.479.479.529.529.579.5710.1510.159.929.9210.1610.1610.0610.0610.210.29.919.9110.7410.7410.5110.5110.7410.7410.3710.3710.5710.5710.7510.7510.910.910.8610.869.989.986.66.67.017.017.297.297.637.637.827.827.837.837.977.978.028.028.098.098.098.098.118.118.268.268.268.268.38.38.428.428.498.498.528.528.898.899.089.089.199.19-2.42-2.42-0.78-0.78-2.18-2.18-1.89-1.89-1.75-1.75-2.32-2.32-1.95-1.95-2.14-2.14-1.97-1.97-2.11-2.11-1.8-1.8-2.48-2.48-2.25-2.25-2.44-2.44-1.95-1.95-2.08-2.08-2.23-2.23-2.01-2.01-1.78-1.78-0.79-0.7910.059510.059510.059510.059510.059510.059510.059510.059510.059510.059510.059510.059510.059510.059510.059510.059510.059510.059510.059510.059510.059510.059510.059510.059510.059510.059510.059510.059510.059510.059510.059510.059510.059510.059510.059510.059510.059510.059510.059510.05958.09358.09358.09358.09358.09358.09358.09358.09358.09358.09358.09358.09358.09358.09358.09358.09358.09358.09358.09358.09358.09358.09358.09358.09358.09358.09358.09358.09358.09358.09358.09358.09358.09358.09358.09358.09358.09358.09358.09358.0935-26.83-26.83-10.01-10.01-23.02-23.02-19.85-19.85-18.29-18.29-22.86-22.86-19.66-19.66-21.06-21.06-19.58-19.58-20.69-20.69-18.16-18.16-23.09-23.09-21.41-21.41-22.72-22.72-18.8-18.8-19.68-19.68-20.74-20.74-18.44-18.44-16.39-16.39-7.92-7.92Ashadh 2080Ashadh 2081Change (Rs.)Average Industry (Ashadh 2080)Average Industry (Ashadh 2081)Percentage Change (%)SCBNLRBBEBLNabilNIMBSanimaNBLParbhuADBLGlobalSBLMBLCitizenNSBINMBPrimeLaxmiSunriseKumariHBLNIC Asia-404812-30-24-18-12-6Highcharts.com
Analysis -13: Earning Per Share (EPS)
|
What Does Earning Per Share mean to Banks?
Earnings Per Share (EPS) is the amount of profit earned by the Bank equivalent to each of its share. Higher the EPS, better it is and vice versa. It is computed by dividing Net Profit by total number of shares of the Bank.
|
Earnings Per Share Performance Analysis:
Standard Chartered Bank Nepal Bank has the highest EPS of Rs.35.09 per share followed by Everest Bank with Rs.31.45 per share. 11 banks have their EPS below industrial average of 17.80 whereas 9 banks have their EPS above industrial average. Kumari Bank has the lowest EPS of Rs. 8.80 per share as on Ashadh 2081.
|
Bank
|
Ashadh 2080
|
Ashadh 2081
|
Change (Rs.)
|
Change%
|
Ranking
|
|
SCBNL
|
37.39
|
35.09
|
(2.30)
|
-6.15%
|
1
|
|
EBL
|
31.43
|
31.45
|
0.02
|
0.06%
|
2
|
|
Nabil
|
23.67
|
26.09
|
2.42
|
10.22%
|
3
|
|
ADBL
|
7.90
|
24.75
|
16.85
|
213.29%
|
4
|
|
RBB
|
24.22
|
21.73
|
(2.49)
|
-10.28%
|
5
|
|
SBL
|
22.48
|
21.40
|
(1.08)
|
-4.80%
|
6
|
|
Prime
|
5.30
|
19.45
|
14.15
|
266.98%
|
7
|
|
NSBI
|
18.74
|
19.18
|
0.44
|
2.35%
|
8
|
|
Parbhu
|
1.19
|
19.03
|
17.84
|
1499.16%
|
9
|
|
Sanima
|
20.91
|
17.54
|
(3.37)
|
-16.12%
|
10
|
|
Global
|
22.06
|
16.65
|
(5.41)
|
-24.52%
|
11
|
|
NIMB
|
13.92
|
15.23
|
1.31
|
9.41%
|
12
|
|
HBL
|
9.18
|
13.10
|
3.92
|
42.70%
|
13
|
|
LaxmiSunrise
|
14.61
|
13.09
|
(1.52)
|
-10.40%
|
14
|
|
NMB
|
17.55
|
12.72
|
(4.83)
|
-27.52%
|
15
|
|
NBL
|
23.39
|
11.28
|
(12.11)
|
-51.77%
|
16
|
|
MBL
|
13.99
|
10.76
|
(3.23)
|
-23.09%
|
17
|
|
Citizen
|
13.12
|
9.45
|
(3.67)
|
-27.97%
|
18
|
|
NIC Asia
|
38.44
|
9.26
|
(29.18)
|
-75.91%
|
19
|
|
Kumari
|
1.97
|
8.80
|
6.83
|
346.70%
|
20
|
|
Average industry
|
18.07
|
17.80
|
(0.27)
|
-1.52%
|
|
Created with Highcharts 11.4.8BanksEPS (Rs.)Percentage Change (%)Earnings Per Share (EPS) Performance Analysis37.3937.3931.4331.4323.6723.677.97.924.2224.2222.4822.485.35.318.7418.741.191.1920.9120.9122.0622.0613.9213.929.189.1814.6114.6117.5517.5523.3923.3913.9913.9913.1213.1238.4438.441.971.9735.0935.0931.4531.4526.0926.0924.7524.7521.7321.7321.421.419.4519.4519.1819.1819.0319.0317.5417.5416.6516.6515.2315.2313.113.113.0913.0912.7212.7211.2811.2810.7610.769.459.459.269.268.88.8-2.3-2.30.020.022.422.4216.8516.85-2.49-2.49-1.08-1.0814.1514.150.440.4417.8417.84-3.37-3.37-5.41-5.411.311.313.923.92-1.52-1.52-4.83-4.83-12.11-12.11-3.23-3.23-3.67-3.67-29.18-29.186.836.8318.07318.07318.07318.07318.07318.07318.07318.07318.07318.07318.07318.07318.07318.07318.07318.07318.07318.07318.07318.07318.07318.07318.07318.07318.07318.07318.07318.07318.07318.07318.07318.07318.07318.07318.07318.07318.07318.07318.07318.07317.802517.802517.802517.802517.802517.802517.802517.802517.802517.802517.802517.802517.802517.802517.802517.802517.802517.802517.802517.802517.802517.802517.802517.802517.802517.802517.802517.802517.802517.802517.802517.802517.802517.802517.802517.802517.802517.802517.802517.8025-6.15-6.150.060.0610.2210.22213.29213.29-10.28-10.28-4.8-4.8266.98266.982.352.351 499.161 499.16-16.12-16.12-24.52-24.529.419.4142.742.7-10.4-10.4-27.52-27.52-51.77-51.77-23.09-23.09-27.97-27.97-75.91-75.91346.7346.7Ashadh 2080Ashadh 2081Change (Rs.)Average Industry (Ashadh 2080)Average Industry (Ashadh 2081)Percentage Change (%)SCBNLEBLNabilADBLRBBSBLPrimeNSBIParbhuSanimaGlobalNIMBHBLLaxmiSunriseNMBNBLMBLCitizenNIC AsiaKumari-50-2502550-600060012001800Highcharts.com
Analysis -14: Non-Performing Loan (NPL)
|
What Does Non-Performing Loan mean to Banks?
Non-Performing Loans (NPL) are those loans which are classified under Doubtful, Substandard and Bad as per the NRB provisions. Higher Non-Performing Loans ratio means higher probability of loan defaults, so Banks try to maintain NPL as low as possible.
|
Non-Performing Loans (NPL) Performance Analysis:
Industry Average non-performing loan (NPL) of overall industry remained at 3.54% as on Ashadh 2081. Higher NPL triggers increased risk of credit defaults and lower changes of credit recovery, so bank’s try to restrict their NPL as low as possible. During the review period, Everest Bank managed to keep its NPL at 0.71% which is lowest amongst peers, followed by Sanima Bank with 1.73% NPL. Highest NPL was reported by Kumari Bank and NIMB Bank with NPL of 4.95% each as on Ashadh 2081. Considering Y-o-Y growth, NPL of NIC ASIA Bank’s growth of 2.53% was highest amongst the peer.
|
Bank
|
Ashadh 2080
|
Ashadh 2081
|
YOY Change
|
Ranking
|
|
EBL
|
0.79%
|
0.71%
|
-0.08%
|
1
|
|
Sanima
|
1.31%
|
1.73%
|
0.42%
|
2
|
|
NSBI
|
2.43%
|
2.00%
|
-0.43%
|
3
|
|
SCBNL
|
1.18%
|
2.14%
|
0.96%
|
4
|
|
SBL
|
2.01%
|
2.22%
|
0.21%
|
5
|
|
NMB
|
2.75%
|
3.27%
|
0.52%
|
6
|
|
NBL
|
2.85%
|
3.28%
|
0.43%
|
7
|
|
NIC Asia
|
0.88%
|
3.41%
|
2.53%
|
8
|
|
ADBL
|
2.78%
|
3.44%
|
0.66%
|
9
|
|
MBL
|
2.26%
|
3.63%
|
1.37%
|
10
|
|
RBB
|
3.77%
|
3.65%
|
-0.12%
|
11
|
|
Nabil
|
3.39%
|
3.85%
|
0.46%
|
12
|
|
Citizen
|
3.39%
|
4.07%
|
0.68%
|
13
|
|
Global
|
3.15%
|
4.37%
|
1.22%
|
14
|
|
Prime
|
4.85%
|
4.67%
|
-0.18%
|
15
|
|
LaxmiSunrise
|
2.91%
|
4.72%
|
1.81%
|
16
|
|
Parbhu
|
4.98%
|
4.78%
|
-0.20%
|
17
|
|
HBL
|
4.93%
|
4.91%
|
-0.02%
|
18
|
|
NIMB
|
4.54%
|
4.95%
|
0.41%
|
19
|
|
Kumari
|
4.96%
|
4.95%
|
-0.01%
|
19
|
|
Average industry
|
3.01%
|
3.54%
|
0.53%
|
|
Created with Highcharts 11.4.8BanksNon-Performing Loans (NPL) PerformanceAnalysis(Rs. in Million)Percentage Change (%)Non-Performing Loans (NPL) Performance Analysis0.790.791.311.312.432.431.181.182.012.012.752.752.852.850.880.882.782.782.262.263.773.773.393.393.393.393.153.154.854.852.912.914.984.984.934.934.544.544.964.960.710.711.731.73222.142.142.222.223.273.273.283.283.413.413.443.443.633.633.653.653.853.854.074.074.374.374.674.674.724.724.784.784.914.914.954.954.954.95-0.08-0.080.420.42-0.43-0.430.960.960.210.210.520.520.430.432.532.530.660.661.371.37-0.12-0.120.460.460.680.681.221.22-0.18-0.181.811.81-0.2-0.2-0.02-0.020.410.41-0.01-0.013.00553.00553.00553.00553.00553.00553.00553.00553.00553.00553.00553.00553.00553.00553.00553.00553.00553.00553.00553.00553.00553.00553.00553.00553.00553.00553.00553.00553.00553.00553.00553.00553.00553.00553.00553.00553.00553.00553.00553.00553.53753.53753.53753.53753.53753.53753.53753.53753.53753.53753.53753.53753.53753.53753.53753.53753.53753.53753.53753.53753.53753.53753.53753.53753.53753.53753.53753.53753.53753.53753.53753.53753.53753.53753.53753.53753.53753.53753.53753.53750000000000000000000000000000000000000000Ashadh 2080 (%)Ashadh 2081 (%)YOY Change (%)Average Industry (Ashadh 2080 (%))Average Industry (Ashadh 2081 (%))Percentage Change (%)EBLSanimaNSBISCBNLSBLNMBNBLNIC AsiaADBLMBLRBBNabilCitizenGlobalPrimeLaxmiSunriseParbhuHBLNIMBKumari-2024601234Highcharts.com
Analysis -15: Cost of Fund
|
What Does Cost of Fund mean to Banks?
Cost of Fund means the cost incurred by the Bank to obtain funds in a form of deposit or borrowings. It includes cost of local currency deposit and borrowings obtained by the Bank.
|
Cost of Fund Performance Analysis:
During the review period lowest cost of fund was of Standard Chartered Bank at 3.84% followed by Rastriye Banijye Bank with 4.89%. This means these banks are soliciting funds at lower costs than peers. However, cost of fund of NMB Bank remained highest amongst peer at 7.31% as on Ashadh 2081. Industry average cost of fund remained at 6.09% as on Ashadh 2081.
|
Bank
|
Ashadh 2080
|
Ashadh 2081
|
YOY Change
|
Ranking
|
|
SCBNL
|
6.91%
|
3.84%
|
-3.07%
|
1
|
|
RBB
|
6.11%
|
4.89%
|
-1.22%
|
2
|
|
NBL
|
6.97%
|
5.36%
|
-1.61%
|
3
|
|
EBL
|
7.75%
|
5.64%
|
-2.11%
|
4
|
|
Parbhu
|
7.83%
|
5.77%
|
-2.06%
|
5
|
|
Nabil
|
7.81%
|
5.86%
|
-1.95%
|
6
|
|
NIMB
|
7.71%
|
5.87%
|
-1.84%
|
7
|
|
MBL
|
7.75%
|
5.87%
|
-1.88%
|
7
|
|
ADBL
|
7.51%
|
5.88%
|
-1.63%
|
9
|
|
SBL
|
7.82%
|
5.95%
|
-1.87%
|
10
|
|
LaxmiSunrise
|
8.38%
|
6.11%
|
-2.27%
|
11
|
|
Sanima
|
8.27%
|
6.13%
|
-2.14%
|
12
|
|
Global
|
8.18%
|
6.21%
|
-1.97%
|
13
|
|
Citizen
|
8.34%
|
6.32%
|
-2.02%
|
14
|
|
Kumari
|
8.50%
|
6.74%
|
-1.76%
|
15
|
|
HBL
|
8.61%
|
6.86%
|
-1.75%
|
16
|
|
NIC Asia
|
7.67%
|
6.96%
|
-0.71%
|
17
|
|
Prime
|
8.67%
|
7.03%
|
-1.64%
|
18
|
|
NSBI
|
8.20%
|
7.12%
|
-1.08%
|
19
|
|
NMB
|
8.31%
|
7.31%
|
-1.00%
|
20
|
|
Average industry
|
7.87%
|
6.09%
|
-1.78%
|
|
Created with Highcharts 11.4.8BanksCost of Fund (Rs.)Percentage Change (%)Cost of Fund Performance Analysis6.916.916.116.116.976.977.757.757.837.837.817.817.717.717.757.757.517.517.827.828.388.388.278.278.188.188.348.348.58.58.618.617.677.678.678.678.28.28.318.313.843.844.894.895.365.365.645.645.775.775.865.865.875.875.875.875.885.885.955.956.116.116.136.136.216.216.326.326.746.746.866.866.966.967.037.037.127.127.317.31-3.07-3.07-1.22-1.22-1.61-1.61-2.11-2.11-2.06-2.06-1.95-1.95-1.84-1.84-1.88-1.88-1.63-1.63-1.87-1.87-2.27-2.27-2.14-2.14-1.97-1.97-2.02-2.02-1.76-1.76-1.75-1.75-0.71-0.71-1.64-1.64-1.08-1.08-1-17.8657.8657.8657.8657.8657.8657.8657.8657.8657.8657.8657.8657.8657.8657.8657.8657.8657.8657.8657.8657.8657.8657.8657.8657.8657.8657.8657.8657.8657.8657.8657.8657.8657.8657.8657.8657.8657.8657.8657.8656.0866.0866.0866.0866.0866.0866.0866.0866.0866.0866.0866.0866.0866.0866.0866.0866.0866.0866.0866.0866.0866.0866.0866.0866.0866.0866.0866.0866.0866.0866.0866.0866.0866.0866.0866.0866.0866.0866.0866.0860000000000000000000000000000000000000000Ashadh 2080 (%)Ashadh 2081 (%)Change (Rs. in Million)Average Industry (Ashadh 2080 (%))Average Industry (Ashadh 2081 (%))Percentage Change (%)SCBNLRBBNBLEBLParbhuNabilNIMBMBLADBLSBLLaxmiSunriseSanimaGlobalCitizenKumariHBLNIC AsiaPrimeNSBINMB-40481201234Highcharts.com
Analysis -16: Capital Adequacy Ratio (CAR)
|
What Does Capital Adequacy Ratio mean to Banks?
Capital Adequacy Ratio (CAR) measures the sufficiency of Bank’s capital in terms of its credit, operation and market or liquidity risk weighted exposures. It indicates the sufficiency of Bank’s capital commensurate to risk pertaining to business growth, gross income and open position. NRB has mandated banks to maintain CAR of at least 11% in line with Capital Adequacy Framework, 2015.
|
Capital Adequacy Ratio (CAR) Performance Analysis:
Industrial average CAR remained at 13.01% as on Ashadh 2081. Standard Chartered Bank managed to remain at top with CAR of 17.16% whose Y-o-Y CAR increased by 0.07% as compared to earlier year followed by Machhapuchhere Bank with CAR of 13.83% a raise of 025% from earlier year. Lowest CAR was reported by NIC ASIA of 11.18% followed by Prime Commercial Bank of 11.90%.
|
Bank
|
Ashadh 2080
|
Ashadh 2081
|
YOY Change
|
Ranking
|
|
SCBNL
|
17.09%
|
17.16%
|
0.07%
|
1
|
|
MBL
|
13.58%
|
13.83%
|
0.25%
|
2
|
|
NIMB
|
13.32%
|
13.67%
|
0.35%
|
3
|
|
Sanima
|
14.42%
|
13.66%
|
-0.76%
|
4
|
|
NBL
|
13.74%
|
13.62%
|
-0.12%
|
5
|
|
Parbhu
|
11.87%
|
13.55%
|
1.68%
|
6
|
|
ADBL
|
14.24%
|
13.44%
|
-0.80%
|
7
|
|
NSBI
|
12.58%
|
13.28%
|
0.70%
|
8
|
|
Citizen
|
12.12%
|
13.13%
|
1.01%
|
9
|
|
LaxmiSunrise
|
13.21%
|
13.11%
|
-0.10%
|
10
|
|
NMB
|
13.33%
|
12.82%
|
-0.51%
|
11
|
|
EBL
|
13.36%
|
12.61%
|
-0.75%
|
12
|
|
Global
|
13.34%
|
12.53%
|
-0.81%
|
13
|
|
Nabil
|
12.54%
|
12.39%
|
-0.15%
|
14
|
|
Kumari
|
12.11%
|
12.26%
|
0.15%
|
15
|
|
SBL
|
12.47%
|
12.15%
|
-0.32%
|
16
|
|
HBL
|
12.31%
|
12.04%
|
-0.27%
|
17
|
|
RBB
|
12.92%
|
11.91%
|
-1.01%
|
18
|
|
Prime
|
12.10%
|
11.90%
|
-0.20%
|
19
|
|
NIC Asia
|
13.39%
|
11.18%
|
-2.21%
|
20
|
|
Average industry
|
13.20%
|
13.01%
|
-0.19%
|
|
Created with Highcharts 11.4.8BanksCAR (%)Percentage Change (%)Capital Adequacy Ratio (CAR) Performance Analysis17.0917.0913.5813.5813.3213.3214.4214.4213.7413.7411.8711.8714.2414.2412.5812.5812.1212.1213.2113.2113.3313.3313.3613.3613.3413.3412.5412.5412.1112.1112.4712.4712.3112.3112.9212.9212.112.113.3913.3917.1617.1613.8313.8313.6713.6713.6613.6613.6213.6213.5513.5513.4413.4413.2813.2813.1313.1313.1113.1112.8212.8212.6112.6112.5312.5312.3912.3912.2612.2612.1512.1512.0412.0411.9111.9111.911.911.1811.180.070.070.250.250.350.35-0.76-0.76-0.12-0.121.681.68-0.8-0.80.70.71.011.01-0.1-0.1-0.51-0.51-0.75-0.75-0.81-0.81-0.15-0.150.150.15-0.32-0.32-0.27-0.27-1.01-1.01-0.2-0.2-2.21-2.2113.20213.20213.20213.20213.20213.20213.20213.20213.20213.20213.20213.20213.20213.20213.20213.20213.20213.20213.20213.20213.20213.20213.20213.20213.20213.20213.20213.20213.20213.20213.20213.20213.20213.20213.20213.20213.20213.20213.20213.20213.01213.01213.01213.01213.01213.01213.01213.01213.01213.01213.01213.01213.01213.01213.01213.01213.01213.01213.01213.01213.01213.01213.01213.01213.01213.01213.01213.01213.01213.01213.01213.01213.01213.01213.01213.01213.01213.01213.01213.0120000000000000000000000000000000000000000Ashadh 2080 (%)Ashadh 2081(%)YOY Change (%)Average Industry (Ashadh 2080 (%))Average Industry (Ashadh 2081 (%))Percentage Change (%)SCBNLMBLNIMBSanimaNBLParbhuADBLNSBICitizenLaxmiSunriseNMBEBLGlobalNabilKumariSBLHBLRBBPrimeNIC Asia-808162401234Highcharts.com
Analysis -17: Credit to Deposit (CD) Ratio
|
What Does CD Ratio mean to Banks?
Credit to Deposit (CD) ratio is the measure which shows proportion of credit and deposit mix of the Bank. Till Ashadh 2081 Banks were allowed to include 50% of their debenture as part of deposit. NRB has set maximum limit of CD ratio at 90%. Higher CD ratio means higher portion of lending as compared to Bank’s deposit volume and lower CD ration means lower portion of lending as compared to Bank’s deposit volume. Banks try to maintain optimum CD ratio by balancing between credit and deposit mix.
|
Credit to Deposit (CD) ratio Performance Analysis:
During the review period industrial average CD ratio remained at 78.48%. Prime Commercial Bank had the highest CD ratio of 86.20% followed by NMB Bank of 83.91%. Lowest CD ratio was reported by Rastriye Banijy Bank of 60.82% a fall by 15.48% as compared to earlier year.
|
Bank
|
Ashadh 2080
|
Ashadh 2081
|
Change
|
Ranking
|
|
Prime
|
88.72%
|
86.20%
|
-2.52%
|
1
|
|
NMB
|
83.46%
|
83.91%
|
0.45%
|
2
|
|
Nabil
|
87.12%
|
83.60%
|
-3.52%
|
3
|
|
HBL
|
84.70%
|
83.37%
|
-1.33%
|
4
|
|
MBL
|
81.35%
|
83.32%
|
1.97%
|
5
|
|
Citizen
|
82.40%
|
81.84%
|
-0.56%
|
6
|
|
Kumari
|
86.03%
|
81.48%
|
-4.55%
|
7
|
|
Sanima
|
79.00%
|
80.53%
|
1.53%
|
8
|
|
EBL
|
82.32%
|
80.29%
|
-2.03%
|
9
|
|
NIMB
|
85.05%
|
79.22%
|
-5.83%
|
10
|
|
SBL
|
77.16%
|
78.70%
|
1.54%
|
11
|
|
NIC Asia
|
83.55%
|
77.98%
|
-5.57%
|
12
|
|
ADBL
|
81.73%
|
77.80%
|
-3.93%
|
13
|
|
SCBNL
|
75.80%
|
76.83%
|
1.03%
|
14
|
|
Global
|
83.47%
|
75.87%
|
-7.60%
|
15
|
|
LaxmiSunrise
|
81.64%
|
75.83%
|
-5.81%
|
16
|
|
Parbhu
|
80.39%
|
74.66%
|
-5.73%
|
17
|
|
NSBI
|
78.99%
|
74.35%
|
-4.64%
|
18
|
|
NBL
|
74.84%
|
72.99%
|
-1.85%
|
19
|
|
RBB
|
76.30%
|
60.82%
|
-15.48%
|
20
|
|
Average industry
|
81.70%
|
78.48%
|
-3.22%
|
|
Created with Highcharts 11.4.8BanksCD Ratio (%)Percentage Change (%)Credit to Deposit (CD) ratio Performance Analysis88.7288.7283.4683.4687.1287.1284.784.781.3581.3582.482.486.0386.03797982.3282.3285.0585.0577.1677.1683.5583.5581.7381.7375.875.883.4783.4781.6481.6480.3980.3978.9978.9974.8474.8476.376.386.286.283.9183.9183.683.683.3783.3783.3283.3281.8481.8481.4881.4880.5380.5380.2980.2979.2279.2278.778.777.9877.9877.877.876.8376.8375.8775.8775.8375.8374.6674.6674.3574.3572.9972.9960.8260.82-2.52-2.520.450.45-3.52-3.52-1.33-1.331.971.97-0.56-0.56-4.55-4.551.531.53-2.03-2.03-5.83-5.831.541.54-5.57-5.57-3.93-3.931.031.03-7.6-7.6-5.81-5.81-5.73-5.73-4.64-4.64-1.85-1.85-15.48-15.4881.70181.70181.70181.70181.70181.70181.70181.70181.70181.70181.70181.70181.70181.70181.70181.70181.70181.70181.70181.70181.70181.70181.70181.70181.70181.70181.70181.70181.70181.70181.70181.70181.70181.70181.70181.70181.70181.70181.70181.70178.479578.479578.479578.479578.479578.479578.479578.479578.479578.479578.479578.479578.479578.479578.479578.479578.479578.479578.479578.479578.479578.479578.479578.479578.479578.479578.479578.479578.479578.479578.479578.479578.479578.479578.479578.479578.479578.479578.479578.47950000000000000000000000000000000000000000Ashadh 2080 (%)Ashadh 2081(%)Change (%)Average Industry (Ashadh 2080 (%))Average Industry (Ashadh 2081 (%))Percentage Change (%)PrimeNMBNabilHBLMBLCitizenKumariSanimaEBLNIMBSBLNIC AsiaADBLSCBNLGlobalLaxmiSunriseParbhuNSBINBLRBB-400408012001234Highcharts.comHBL● Ashadh 2080 (%): 84.7● Ashadh 2081(%): 83.37● Change (%): -1.33● Average Industry (Ashadh 2080 (%)): 81.701● Average Industry (Ashadh 2081 (%)): 78.4795● Percentage Change (%): 0