Industry and Commercial Finance Company Deposit and Credit Status
|
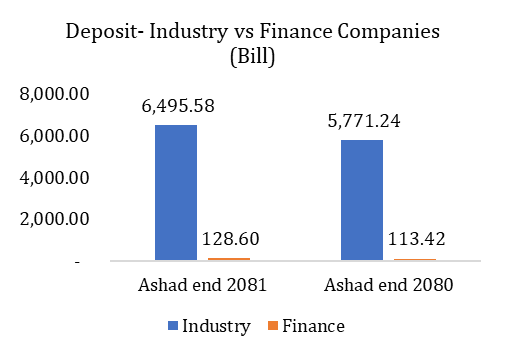
Deposit Growth
|
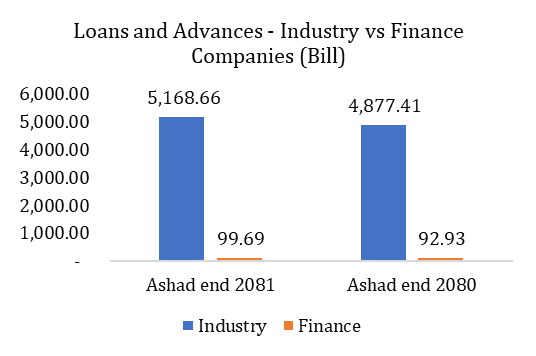
Credit Growth
|
|
Year on Year Industry average Deposits of overall Banks and Financial institutions grew by 12.55% i.e. from Rs. 5,771.24 Billion to Rs. 6,495.58 Billion if compared to Ashadh 2081 and Ashadh 2080. However, overall industrial deposits of Finance Companies grew by 13.38% from Rs.113.42 Billion to Rs 128.60 Billion during this period.
|
As compared to Ashadh 2080, Credit growth of overall industry remained as on Ashadh 2081 remained at 5.97% i.e. from Rs.4,877.41 Billion to Rs.5,168.66 Billion compared. Overall Loans of Finance Companies grew by 7.27% from Rs.92.93 Billion to Rs.99.69 Billion.
|
|
|
Performance Analysis of Finance Companies- Ashadh 2081
Analysis -1: Loans and Advances
 |
What does Loans and Advances mean to Finance Company?
Loans and Advance is the Balance Sheet items classified under Assets side of the Company’s Balance Sheets. Loans and Advances includes Loans provided to normal customers by the Finance Company as well as institutional loans provided by Finance Companies to BFIs.
|
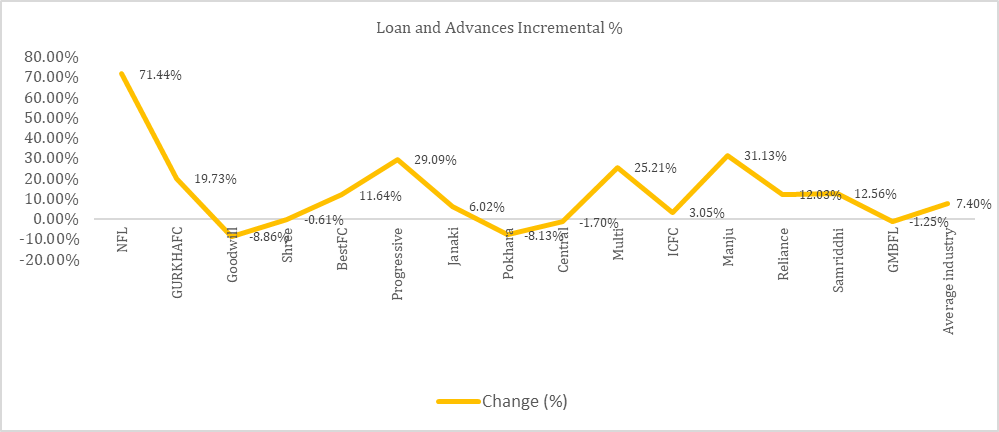
Year-on-Year growth of Loans and Advances of Finance Companies grew by 7.40% on Ashadh 2081. Most of the Finance Companies managed to increase their credit portfolio. During the review period all Finance Companies except Goodwill Finance, Shree Investment and Finance Co., Pokhara Finance, Central Finance, and Guheshwori Merchant Finance Companying Finance ltd have increased their credit portfolio as compared to Ashadh 2080. Manjushree Finance Ltd. leads the chart with highest credit portfolio of Rs. 15.47 Billion whose credit portfolio increased by 31.13% as compared to earlier year. ICFC Finance Ltd is second in the list with Rs.14.81 Billion credit portfolio up by 3.05% from previous year followed by Goodwill Finance Ltd with Rs.8.93 Billion. Most significant credit growth was done by Nepal Finance Ltd with 71.44% Y-o-Y growth. Goodwill Finance remained sluggish in terms of credit growth with portfolio size of Rs. 8.93 Billion down by 8.86% as compared to earlier year.
Billion
|
Finance Company
|
Ashadh 2080
|
Ashadh 2081
|
Change (Rs. in Bn)
|
Change (%)
|
Ranking
|
|
Manju
|
11.80
|
15.47
|
3.67
|
31.13%
|
1
|
|
ICFC
|
14.37
|
14.81
|
0.44
|
3.05%
|
2
|
|
Goodwill
|
9.80
|
8.93
|
(0.87)
|
-8.86%
|
3
|
|
Pokhara
|
9.69
|
8.90
|
(0.79)
|
-8.13%
|
4
|
|
GURKHAFC
|
6.16
|
7.38
|
1.22
|
19.73%
|
5
|
|
Reliance
|
5.74
|
6.43
|
0.69
|
12.03%
|
6
|
|
GMBFL
|
6.08
|
6.01
|
(0.08)
|
-1.25%
|
7
|
|
Shree
|
5.67
|
5.63
|
(0.03)
|
-0.61%
|
8
|
|
Central
|
5.28
|
5.19
|
(0.09)
|
-1.70%
|
9
|
|
Progressive
|
3.50
|
4.52
|
1.02
|
29.09%
|
10
|
|
BestFC
|
3.63
|
4.05
|
0.42
|
11.64%
|
11
|
|
Janaki
|
3.49
|
3.70
|
0.21
|
6.02%
|
12
|
|
NFL
|
1.15
|
1.97
|
0.82
|
71.44%
|
13
|
|
Samriddhi
|
1.54
|
1.74
|
0.19
|
12.56%
|
14
|
|
Multi
|
1.17
|
1.46
|
0.29
|
25.21%
|
15
|
|
Average industry
|
5.94
|
6.41
|
0.47
|
7.40%
|
|
Analysis -2: Deposits
 |
What Does Deposit mean to Finance Company?
Deposits if the total fund collected by the Finance Company from its customers. Deposit is shown in liability side of Company’s Balance Sheet which consists of “Due to Finance Company and Financial Institutions” and “Deposit from Customers”. Finance Company normally collect deposit in a form of Fixed, Saving, Current, Call, Margin, Recurring accounts.
|
Deposit Performance Analysis:
All the Finance Companies except ICFC Finance managed to increase their Deposit Volume during the review period. Overall deposits of Finance Companies grew by 11.50% on an average during the review period. ICFC Finance’s deposit portfolio remained highest at Rs.18.78 Billion followed by Manjushree Finance Ltd at Rs.17.62 Billion. In terms of Y-o-Y growth National Finance Ltd’s deposit grew by 42.82% and remained at Rs.2.79 Billion, followed by Progressive Finance Ltd. 27.29% increment. Lowest Deposit is being held by Multipurpose Finance Co. at Rs.0.34 Billion.
Billion
|
Finance Company
|
Ashadh 2080
|
Ashadh 2081
|
Change (Rs.)
|
Change (%)
|
Ranking
|
|
ICFC
|
19.11
|
18.78
|
(0.33)
|
-1.72%
|
1
|
|
Manju
|
13.87
|
17.62
|
3.75
|
27.07%
|
2
|
|
Pokhara
|
12.16
|
13.21
|
1.05
|
8.61%
|
3
|
|
Goodwill
|
11.58
|
12.66
|
1.08
|
9.35%
|
4
|
|
GURKHAFC
|
8.31
|
9.71
|
1.40
|
16.90%
|
5
|
|
GMBFL
|
7.66
|
8.33
|
0.67
|
8.72%
|
6
|
|
Reliance
|
6.85
|
8.23
|
1.38
|
20.14%
|
7
|
|
Central
|
6.95
|
7.70
|
0.75
|
10.76%
|
8
|
|
Shree
|
7.23
|
7.42
|
0.19
|
2.64%
|
9
|
|
Progressive
|
5.09
|
6.48
|
1.39
|
27.29%
|
10
|
|
BestFC
|
4.39
|
5.46
|
1.07
|
24.36%
|
11
|
|
Janaki
|
3.58
|
4.10
|
0.52
|
14.40%
|
12
|
|
NFL
|
1.95
|
2.79
|
0.84
|
42.82%
|
13
|
|
Samriddhi
|
1.97
|
2.46
|
0.49
|
25.14%
|
14
|
|
Multi
|
1.53
|
1.87
|
0.34
|
22.17%
|
15
|
|
Average industry
|
7.48
|
8.45
|
0.97
|
11.50%
|
|

Analysis -3: Net Interest Income (NII)
 |
What Does Net Interest Income (NII) mean to Finance Company?
Interest Income is recognized on interest bearing advances and financial assets whose income is booked to statement of profit or loss under interest income, whereas Interest Expenses is booked on interest bearing deposits or financial liabilities whose expenses is booked in statement of profit or loss under interest expenses. The net difference between these income and expenses is referred as Net Interest Income (NII).
|
Net Interest Income (NII) Performance Analysis:
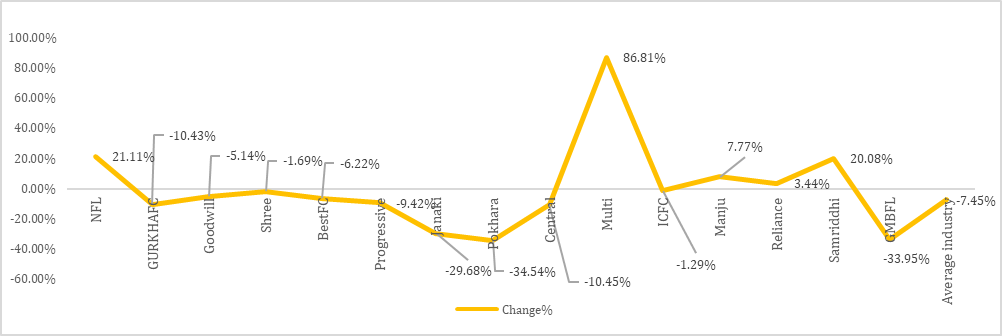
NII being the major source of Company’s revenue is a primary area to focus for Finance Companies. NII of 10 Finance Companies shows negative growth whereas of 5 finance companies managed to increase their NII as on Ashadh 2081. Leading the NII in terms of highest amount is Manjushree Finance Ltd with NII of Rs.755.32 Million followed by ICFC Finance with Rs.542.31 Million. Y-o-Y growth of Manjushree finance is 7.77% and ICFC down by 1.29%. In terms of highest Y-O-Y growth Milti Purpose Finance managed to increase its NII by 86.81% from Rs.48.31 Million to Rs.90.24 Million. In terms of lowest Y-o-Y growth, Pokhara Finance’s NII fell by 34.51% followed by Guheshowori Merchant Finance Company fall of 33.95% each. In terms of amount lowest NII was reported by Samriddhi Finance Rs.84.41 Million. Industry Average NII downfall stands at 7.45 %.
Million
|
Finance Company
|
Ashadh 2080
|
Ashadh 2081
|
Change (Rs.)
|
Change%
|
Ranking
|
|
Manju
|
700.88
|
755.32
|
54.44
|
7.77%
|
1
|
|
ICFC
|
549.39
|
542.31
|
(7.08)
|
-1.29%
|
2
|
|
Goodwill
|
335.86
|
318.60
|
(17.26)
|
-5.14%
|
3
|
|
GURKHAFC
|
351.58
|
314.92
|
(36.66)
|
-10.43%
|
4
|
|
Pokhara
|
471.19
|
308.45
|
(162.74)
|
-34.54%
|
5
|
|
Central
|
258.33
|
231.33
|
(27.00)
|
-10.45%
|
6
|
|
Reliance
|
210.37
|
217.61
|
7.24
|
3.44%
|
7
|
|
Shree
|
216.03
|
212.37
|
(3.65)
|
-1.69%
|
8
|
|
GMBFL
|
266.62
|
176.11
|
(90.50)
|
-33.95%
|
9
|
|
Progressive
|
167.81
|
152.01
|
(15.80)
|
-9.42%
|
10
|
|
BestFC
|
130.93
|
122.78
|
(8.14)
|
-6.22%
|
11
|
|
Janaki
|
160.83
|
113.10
|
(47.73)
|
-29.68%
|
12
|
|
NFL
|
91.45
|
110.76
|
19.30
|
21.11%
|
13
|
|
Multi
|
48.31
|
90.24
|
41.93
|
86.81%
|
14
|
|
Samriddhi
|
70.29
|
84.41
|
14.12
|
20.08%
|
15
|
|
Average industry
|
268.66
|
250.02
|
(18.64)
|
-7.45%
|
|
Analysis -4: Net Fee and Commission Income (NFCI)
 |
What Does Net Fee and Commission Income (NFCI) mean to Finance Company?
Net Fees and Commission Income is supplementary source of revenue in addition to Net Interest Income of the Finance Company consisting of charges, fees or commission on products or services offered by the Finance Company. Finance Company’s normally collect loan administration fees, renewal fees, digital Finance Companying fees, card issuance fees, remittance commission among others.
|
Net Fees and Commission Income Performance Analysis:
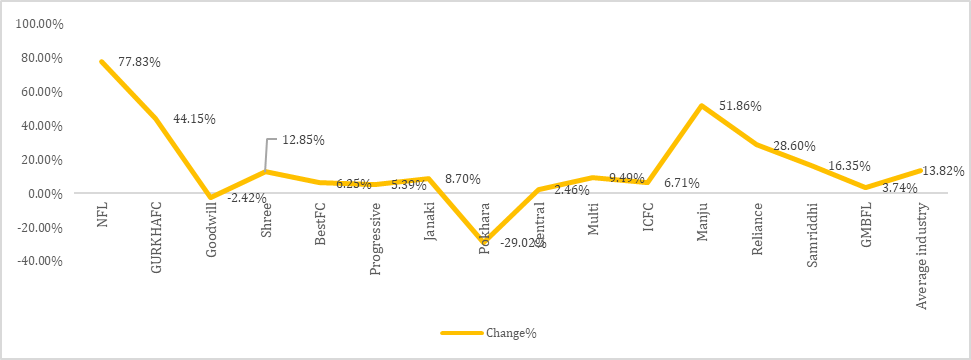
During the review period Manjushree Finance managed to collect highest NFCI of Rs. 87.59 Million up by 51.86% as compared to earlier year followed by ICFC Finance with NFCI of Rs.85.95 Million up by 6.71% as compared to earlier year. Nepal Finance Ltd’s NFCI increased by hefty 77.83% during review period. Goodwill Finance and Pokhara Finance however encountered negative growth on NFCI with 2.52% and 29.02% fall respectively as compared to Ashadh 2080. In terms of lowest NFCI, Progressive Finance collected only Rs.0.86 Million from NFCI. Average industrial growth of NFCI for Finance Companies remained at 13.82% during the review period.
Million
|
Finance Company
|
Ashadh 2080
|
Ashadh 2081
|
Change (Rs.)
|
Change%
|
Ranking
|
|
Manju
|
57.68
|
87.59
|
29.91
|
51.86%
|
1
|
|
ICFC
|
80.54
|
85.95
|
5.40
|
6.71%
|
2
|
|
GURKHAFC
|
32.18
|
46.38
|
14.21
|
44.15%
|
3
|
|
Goodwill
|
46.09
|
44.97
|
(1.11)
|
-2.42%
|
4
|
|
Reliance
|
32.40
|
41.66
|
9.27
|
28.60%
|
5
|
|
Shree
|
24.49
|
27.63
|
3.15
|
12.85%
|
6
|
|
BestFC
|
24.04
|
25.54
|
1.50
|
6.25%
|
7
|
|
GMBFL
|
22.96
|
23.82
|
0.86
|
3.74%
|
8
|
|
Central
|
21.33
|
21.86
|
0.52
|
2.46%
|
9
|
|
Pokhara
|
27.05
|
19.20
|
(7.85)
|
-29.02%
|
10
|
|
NFL
|
7.19
|
12.78
|
5.59
|
77.83%
|
11
|
|
Multi
|
11.18
|
12.24
|
1.06
|
9.49%
|
12
|
|
Samriddhi
|
6.11
|
7.11
|
1.00
|
16.35%
|
13
|
|
Janaki
|
5.09
|
5.53
|
0.44
|
8.70%
|
14
|
|
Progressive
|
0.82
|
0.86
|
0.04
|
5.39%
|
15
|
|
Average industry
|
26.61
|
30.88
|
4.27
|
13.82%
|
|
Analysis -5: Impairment Charges
 |
What Does Impairment Charges mean to Finance Company?
Impairment Charges are charges recognized as expenses by Finance Company when Finance Company expects that they will not recover full amount of expected cash flows of loans. Impairment Charges are reversed if the expected cash flows are lateral realized. Finance Company’s try to minimize their Impairment Charges to increase their profitability through stronger recovery actions.
|
Impairment Charges Performance Analysis:
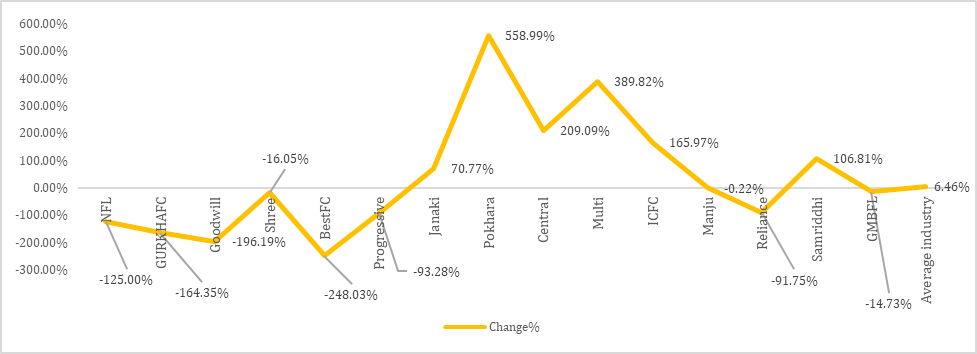
Impairment charges of overall industry increased by 6.46% on average during the review period. Impairment Charges of Goodwill Finance Company decreased by hefty Rs.62.16 Million i.e. by 196.19% as compared to Ashadh 2080. Gurkha Finance Company has the impairment reversal of Rs.54.91 Million during Ashadh 2081. Goodwill Finance Company Nepal has the second lowest impairment charges whose impairment charges decreased by 196.19% as on Ashadh 2081. Pokhara Finance Company has the highest impairment charges of Rs.452.69 Million followed by Janaki Finance Company with Rs.211.80 Million of impairment charges. Highest Year-on-Year growth on impairment charges was reported by Pokhara Finance with massive 558.99% increment from Rs. 68.70 Million to Rs.452.69 Million. Multi Purpose Finance Company also reported increase by 389.82% on its impairment charges from Rs.7.67 Million to Rs.37.58 Million.
Million
|
Finance Company
|
Ashadh 2080
|
Ashadh 2081
|
Change (Rs.)
|
Change%
|
Ranking
|
|
GURKHAFC
|
85.32
|
(54.91)
|
(140.23)
|
-164.35%
|
1
|
|
Goodwill
|
31.68
|
(30.48)
|
(62.16)
|
-196.19%
|
2
|
|
BestFC
|
13.13
|
(19.44)
|
(32.57)
|
-248.03%
|
3
|
|
NFL
|
(25.04)
|
6.26
|
31.30
|
-125.00%
|
4
|
|
Reliance
|
201.17
|
16.60
|
(184.57)
|
-91.75%
|
5
|
|
Progressive
|
289.51
|
19.45
|
(270.06)
|
-93.28%
|
6
|
|
Shree
|
26.79
|
22.49
|
(4.30)
|
-16.05%
|
7
|
|
Multi
|
7.67
|
37.58
|
29.91
|
389.82%
|
8
|
|
GMBFL
|
87.87
|
74.93
|
(12.94)
|
-14.73%
|
9
|
|
Samriddhi
|
44.16
|
91.32
|
47.17
|
106.81%
|
10
|
|
Manju
|
91.89
|
91.69
|
(0.20)
|
-0.22%
|
11
|
|
ICFC
|
56.66
|
150.70
|
94.04
|
165.97%
|
12
|
|
Central
|
53.95
|
166.75
|
112.80
|
209.09%
|
13
|
|
Janaki
|
124.03
|
211.80
|
87.77
|
70.77%
|
14
|
|
Pokhara
|
68.70
|
452.69
|
384.00
|
558.99%
|
15
|
|
Average industry
|
77.17
|
82.50
|
5.33
|
6.46%
|
|
Analysis -6: Personnel Expenses (Excluding Bonus)
 |
What Does Personnel Expenses mean to Finance Company?
Personnel expenses includes expenses related to employees of the Finance Company. Personnel Expenses mostly include staff’s salary, allowances, pension, gratuity, contribution to provident fund, training expenses, uniform expenses, insurance, staff bonus, finance expense under NFRS etc. Finance Company are required to create provision for staff bonus which is a mandatory requirement under the requirement of the Bonus Act, 2074. Amount of bonus is not included here under analysis.
|
Personnel Expenses (Excluding Bonus) Performance Analysis:
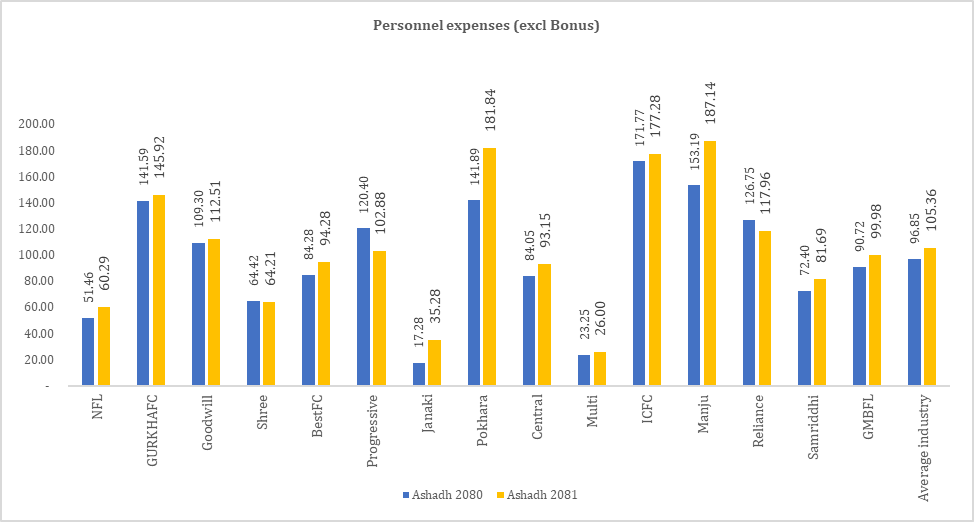
Multipurpose Finance Company seems to have well managed its Personnel expenses with lowest Personal Expenses as on Ashadh 2081 of 26 Million followed by Janaki Finance Company with 35.28 Million. Highest personnel expense was reported by Manjushree Finance with Rs. 187.14 Million followed by Pokhara Finance Company with Rs.181.89 Million. In terms of highest Y-o-Y growth, Janaki Finance Company’s personnel expenses excluding bonus increased by 104.14% followed by Pokhara Finance Company with 28.15% increment. Overall Industry’s average personnel expenses remained at Rs. 105.36 Million up by 8.51 Million with increment of 8.08% y-o-y.
Million
|
Finance Company
|
Ashadh 2080
|
Ashadh 2081
|
Change (Rs.)
|
Change%
|
Ranking
|
|
Multi
|
23.25
|
26.00
|
2.75
|
11.85%
|
1
|
|
Janaki
|
17.28
|
35.28
|
18.00
|
104.14%
|
2
|
|
NFL
|
51.46
|
60.29
|
8.82
|
17.15%
|
3
|
|
Shree
|
64.42
|
64.21
|
(0.20)
|
-0.32%
|
4
|
|
Samriddhi
|
72.40
|
81.69
|
9.29
|
12.83%
|
5
|
|
Central
|
84.05
|
93.15
|
9.10
|
10.82%
|
6
|
|
BestFC
|
84.28
|
94.28
|
10.00
|
11.87%
|
7
|
|
GMBFL
|
90.72
|
99.98
|
9.26
|
10.21%
|
8
|
|
Progressive
|
120.40
|
102.88
|
(17.51)
|
-14.55%
|
9
|
|
Goodwill
|
109.30
|
112.51
|
3.21
|
2.94%
|
10
|
|
Reliance
|
126.75
|
117.96
|
(8.79)
|
-6.93%
|
11
|
|
GURKHAFC
|
141.59
|
145.92
|
4.33
|
3.06%
|
12
|
|
ICFC
|
171.77
|
177.28
|
5.52
|
3.21%
|
13
|
|
Pokhara
|
141.89
|
181.84
|
39.95
|
28.15%
|
14
|
|
Manju
|
153.19
|
187.14
|
33.95
|
22.16%
|
15
|
|
Average industry
|
96.85
|
105.36
|
8.51
|
8.08%
|
|
Per branch staff expenses (Excluding bonus) Performance Analysis
Guneshwori Merchant Finance Company seems to have best managed its per branch staff expenses with lowest per branch expenses of Rs.3.70 Million, followed by Progressive Finance Company with Rs.3.81 Million. Some of the Finance Companies like Shree Investment, Progressive Finance and Reliance Finance Company managed to reduce its per branch staff expenses excluding bonus by 0.32%, 14.15%, and 6.93% respectively. In terms of highest per branch staff expenses, ICFC Finance Company has the highest per branch staff expenses of Rs.8,06 Million followed by Janaki Finance Company with Rs.7.06 Million. Average Per branch staff expenses increase by 10.94% on Y-o-Y basis.
Million
|
Finance Company
|
Ashadh 2080
|
Ashadh 2081
|
Change (Rs.)
|
Change%
|
Ranking
|
|
GMBFL
|
3.36
|
3.70
|
0.34
|
10.21%
|
1
|
|
Progressive
|
4.46
|
3.81
|
(0.65)
|
-14.55%
|
2
|
|
NFL
|
3.96
|
4.64
|
0.68
|
17.15%
|
3
|
|
Central
|
4.20
|
4.66
|
0.45
|
10.82%
|
4
|
|
Shree
|
4.96
|
4.94
|
(0.02)
|
-0.32%
|
5
|
|
BestFC
|
4.44
|
4.96
|
0.53
|
11.87%
|
6
|
|
Multi
|
4.65
|
5.20
|
0.55
|
11.85%
|
7
|
|
Reliance
|
5.76
|
5.36
|
(0.40)
|
-6.93%
|
8
|
|
GURKHAFC
|
5.24
|
5.40
|
0.16
|
3.06%
|
9
|
|
Goodwill
|
5.75
|
5.92
|
0.17
|
2.94%
|
10
|
|
Samriddhi
|
5.57
|
6.28
|
0.71
|
12.83%
|
11
|
|
Manju
|
5.67
|
6.93
|
1.26
|
22.16%
|
12
|
|
Pokhara
|
5.46
|
6.99
|
1.54
|
28.15%
|
13
|
|
Janaki
|
3.46
|
7.06
|
3.60
|
104.14%
|
14
|
|
ICFC
|
7.81
|
8.06
|
0.25
|
3.21%
|
15
|
|
Average industry
|
4.98
|
5.59
|
0.61
|
10.94%
|
|
Analysis -7: Operating Expenses
 |
What Does Operating Expenses mean to Finance Company?
Operating expenses of the Finance Company includes day to day operation related expenses and consists of Personnel Expenses, Depreciation and Amortization and other operating expenses of the Finance Company like Operating Expenses consists of Administration Expenses, Audit Fees, Lease Expenses among others.
|
Operating Expenses Performance Analysis:
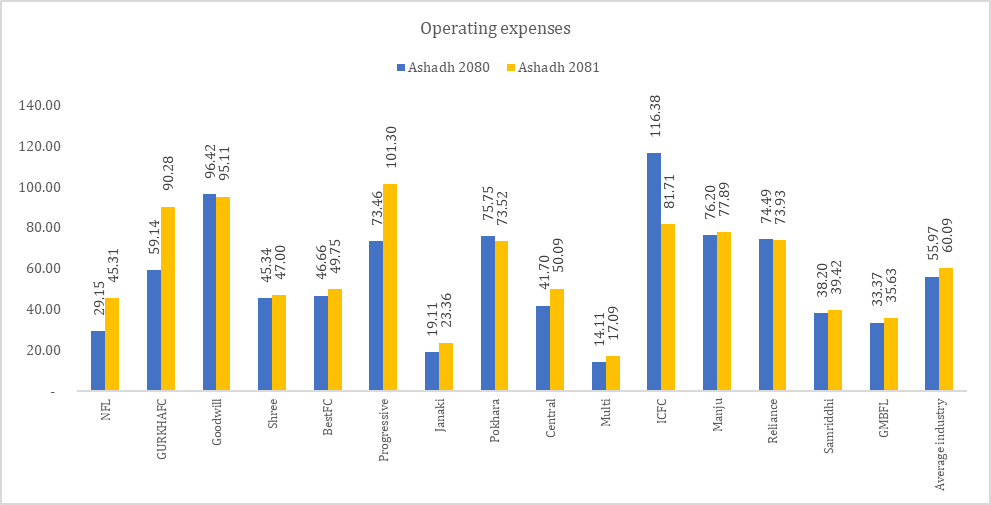
Multipurpose Finance Company seems to have best managed its operating expenses with lowest Operating Expenses of Rs.17.09 Million as on Ashadh 2081. Highest amount of operating expenses was reported by Progressive Finance Company of Rs. 101.30 Million. In terms of highest Y-o-Y growth, Operating Expenses of Nepal Finance Ltd increased by 55.43% as compared to previous year. Goodwill Finance and Pokhara Finance, ICFC Finance and Reliance Finance managed to decrease their operating expenses by 1.36%, 2.94%, 29.79% and 0.75% respectively during the review period. Overall Industry’s average operating expenses grew by 6.87% y-o-y.
Million
|
Finance Company
|
Ashadh 2080
|
Ashadh 2081
|
Change (Rs.)
|
Change%
|
Ranking
|
|
Multi
|
14.11
|
17.09
|
2.98
|
21.09%
|
1
|
|
Janaki
|
19.11
|
23.36
|
4.25
|
22.25%
|
2
|
|
GMBFL
|
33.37
|
35.63
|
2.26
|
6.77%
|
3
|
|
Samriddhi
|
38.20
|
39.42
|
1.22
|
3.20%
|
4
|
|
NFL
|
29.15
|
45.31
|
16.16
|
55.43%
|
5
|
|
Shree
|
45.34
|
47.00
|
1.66
|
3.66%
|
6
|
|
BestFC
|
46.66
|
49.75
|
3.09
|
6.62%
|
7
|
|
Central
|
41.70
|
50.09
|
8.39
|
20.13%
|
8
|
|
Pokhara
|
75.75
|
73.52
|
(2.23)
|
-2.94%
|
9
|
|
Reliance
|
74.49
|
73.93
|
(0.56)
|
-0.75%
|
10
|
|
Manju
|
76.20
|
77.89
|
1.69
|
2.22%
|
11
|
|
ICFC
|
116.38
|
81.71
|
(34.67)
|
-29.79%
|
12
|
|
GURKHAFC
|
59.14
|
90.28
|
31.13
|
52.64%
|
13
|
|
Goodwill
|
96.42
|
95.11
|
(1.31)
|
-1.36%
|
14
|
|
Progressive
|
73.46
|
101.30
|
27.84
|
37.89%
|
15
|
|
Average industry
|
55.97
|
60.09
|
4.13
|
6.87%
|
|
Per Branch Operating Expenses Performance Analysis:
In terms of per branch operating expenses also, Guheshwori Finance Company seems to have lowest per branch operating costs of Rs. 1.32 Million followed by Central Finance Company with Rs. 2.50 Million. In terms of Year-on-Year variance Nepal Goodwill Finance, Pokhara Finance, ICFC Finance and Reliance Finance Company’s operating expenses has decreased as compared to earlier year by 1.36%, 2.94%, 29.79% and 0.75% respectively whereas Laxmi Sunrise Finance Company’s per branch operating expenses increased by hefty 97.43% during the review period due to its merger effect. Overall Industry’s average per branch operating expenses grew by 8.21% y-o-y.
|
Finance Company
|
Ashadh 2080
|
Ashadh 2081
|
Change (Rs.)
|
Change%
|
Ranking
|
|
GMBFL
|
1.24
|
1.32
|
0.08
|
6.77%
|
1
|
|
Central
|
2.09
|
2.50
|
0.42
|
20.13%
|
2
|
|
BestFC
|
2.46
|
2.62
|
0.16
|
6.62%
|
3
|
|
Pokhara
|
2.91
|
2.83
|
(0.09)
|
-2.94%
|
4
|
|
Manju
|
2.82
|
2.88
|
0.06
|
2.22%
|
5
|
|
Samriddhi
|
2.94
|
3.03
|
0.09
|
3.20%
|
6
|
|
GURKHAFC
|
2.19
|
3.34
|
1.15
|
52.64%
|
7
|
|
Reliance
|
3.39
|
3.36
|
(0.03)
|
-0.75%
|
8
|
|
Multi
|
2.82
|
3.42
|
0.60
|
21.09%
|
9
|
|
NFL
|
2.24
|
3.49
|
1.24
|
55.43%
|
10
|
|
Shree
|
3.49
|
3.62
|
0.13
|
3.66%
|
11
|
|
ICFC
|
5.29
|
3.71
|
(1.58)
|
-29.79%
|
12
|
|
Progressive
|
2.72
|
3.75
|
1.03
|
37.89%
|
13
|
|
Janaki
|
3.82
|
4.67
|
0.85
|
22.25%
|
14
|
|
Goodwill
|
5.07
|
5.01
|
(0.07)
|
-1.36%
|
15
|
|
Average industry
|
3.03
|
3.30
|
0.27
|
8.21%
|
|
Analysis -8: Loan Write-offs
 |
What Does Loan Write-offs mean to Finance Company?
Loans are written off by the Finance Company when Finance Company’s consider loans to be uncollectable even after necessary recovery efforts from the Finance Company. Written off loans are removed from Finance Company’s Balance Sheet and are booked as expenses under non-operating expenses of the Finance Company reducing Finance Company’s profit.
|
Loan Write-offs Performance Analysis:
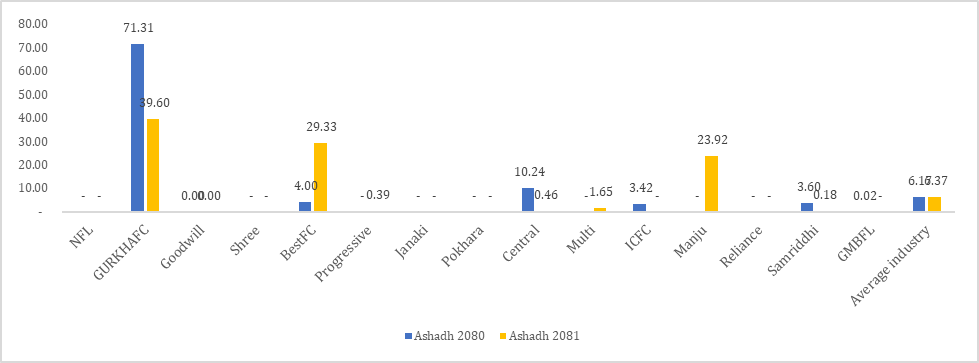
During the review period Nepal Finance Company, Shree Investment, Janaki Finance, Pokhara Finance, ICFC Finance, Reliance Finance and Guheshwori Finance have not written-offs any loans whereas highest value of loan was written-off by Gurkhas Finance Company Limited of Rs.39.60 Million followed by Best Finance Company with written off loan of Rs.29.33 Million. In terms of Y-o-Y comparison Best Finance Company’s write-off expenses surged by 633.33%. Overall Industry’s average Loan Write-off expenses increase by 3.09% y-o-y.
Million
|
Finance Company
|
Ashadh 2080
|
Ashadh 2081
|
Change (Rs.)
|
Change%
|
Ranking
|
|
NFL
|
-
|
-
|
-
|
0.00%
|
1
|
|
Goodwill
|
-
|
-
|
-
|
0.00%
|
1
|
|
Shree
|
-
|
-
|
-
|
0.00%
|
1
|
|
Janaki
|
-
|
-
|
-
|
0.00%
|
1
|
|
Pokhara
|
-
|
-
|
-
|
0.00%
|
1
|
|
ICFC
|
3.42
|
-
|
(3.42)
|
-100.00%
|
1
|
|
Reliance
|
-
|
-
|
-
|
0.00%
|
1
|
|
GMBFL
|
0.02
|
-
|
(0.02)
|
-100.00%
|
1
|
|
Samriddhi
|
3.60
|
0.18
|
(3.41)
|
-94.89%
|
2
|
|
Progressive
|
-
|
0.39
|
0.39
|
0.00%
|
3
|
|
Central
|
10.24
|
0.46
|
(9.78)
|
-95.49%
|
4
|
|
Multi
|
-
|
1.65
|
1.65
|
0.00%
|
5
|
|
Manju
|
-
|
23.92
|
23.92
|
0.00%
|
6
|
|
BestFC
|
4.00
|
29.33
|
25.33
|
633.20%
|
7
|
|
GURKHAFC
|
71.31
|
39.60
|
(31.71)
|
-44.47%
|
8
|
|
Average industry
|
6.17
|
6.37
|
0.20
|
3.09%
|
|
Analysis -9: Net Profit After Tax (NPAT)
 |
What Does Net Profit After Tax (NPAT) mean to Finance Company?
Net Profit After Tax (NPAT) means the final profit after deduction of all the expenses and taxes of the Finance Company. Net Profit helps to judge the profitability healthiness of the Finance Company. Higher the NPAT better is the Finance Company’s performance in terms of return to shareholders.
|
Net Profit After Tax Performance Analysis:
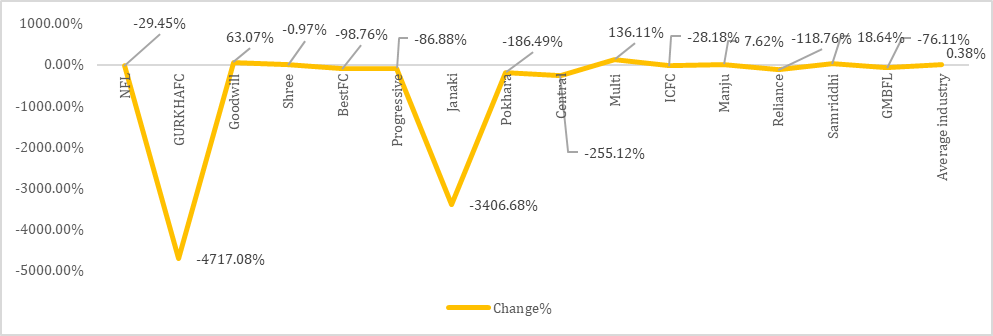
Average Net Profit After Tax of overall Finance Companies grew at 0.38% Y-o-Y. Manju Shree Finance Company reported highest net profit as on Ashadh 2081 with Rs.265.82 Million followed by Goodwill Finance Company with Rs.148.43 Million. Highest Y-o-Y increase in Net Profit was reported by Multipurpose Finance Company with 136.11% increment in Net Profit thanks to its increase on net interest income by Rs. 41 million. Multipurpose Finance Company is followed by Goodwill Finance Company with Goodwill Finance by 63.07% Y-o-Y increment whose impairment charges were reversed by Rs. 62 Million. In terms of negative growth, NPAT of all finance companies except Gurkhas Finance, Goodwill Finance, Multipurpose, Manjushree and Reliance Finance has been decreased as compared to previous year NPAT.
Million
|
Finance Company
|
Ashadh 2080
|
Ashadh 2081
|
Change (Rs.)
|
Change%
|
Ranking
|
|
Manju
|
247.00
|
265.82
|
18.82
|
7.62%
|
1
|
|
Goodwill
|
91.02
|
148.43
|
57.41
|
63.07%
|
2
|
|
ICFC
|
165.21
|
118.65
|
(46.56)
|
-28.18%
|
3
|
|
GURKHAFC
|
(2.36)
|
108.94
|
111.30
|
-4717.08%
|
4
|
|
Shree
|
67.49
|
66.84
|
(0.65)
|
-0.97%
|
5
|
|
Reliance
|
(154.13)
|
28.92
|
183.05
|
-118.76%
|
6
|
|
Multi
|
8.62
|
20.34
|
11.73
|
136.11%
|
7
|
|
NFL
|
25.68
|
18.12
|
(7.56)
|
-29.45%
|
8
|
|
GMBFL
|
64.82
|
15.49
|
(49.34)
|
-76.11%
|
9
|
|
BestFC
|
38.67
|
0.48
|
(38.19)
|
-98.76%
|
10
|
|
Progressive
|
(290.23)
|
(38.08)
|
252.15
|
-86.88%
|
11
|
|
Central
|
41.18
|
(63.88)
|
(105.06)
|
-255.12%
|
12
|
|
Samriddhi
|
(79.85)
|
(94.74)
|
(14.89)
|
18.64%
|
13
|
|
Pokhara
|
123.09
|
(106.46)
|
(229.55)
|
-186.49%
|
14
|
|
Janaki
|
4.15
|
(137.16)
|
(141.31)
|
-3406.68%
|
15
|
|
Average industry
|
23.36
|
23.45
|
0.09
|
0.38%
|
|
Analysis -10: Distributable Profit and DPS
 |
What Does Distributable Profit and DPS mean to Finance Company?
Distributable Profit (DP) means the final profit which is available for distribution to shareholders. If the same distributable profit is divided by number of available shares with Finance Company then Dividend Per Share (DPS) is derived which shows how much dividend a share will generate. Higher the distributable profit and DPS better will be the Finance Company from Shareholders perspective..
|
Distributable Profit and DPS Performance Analysis:
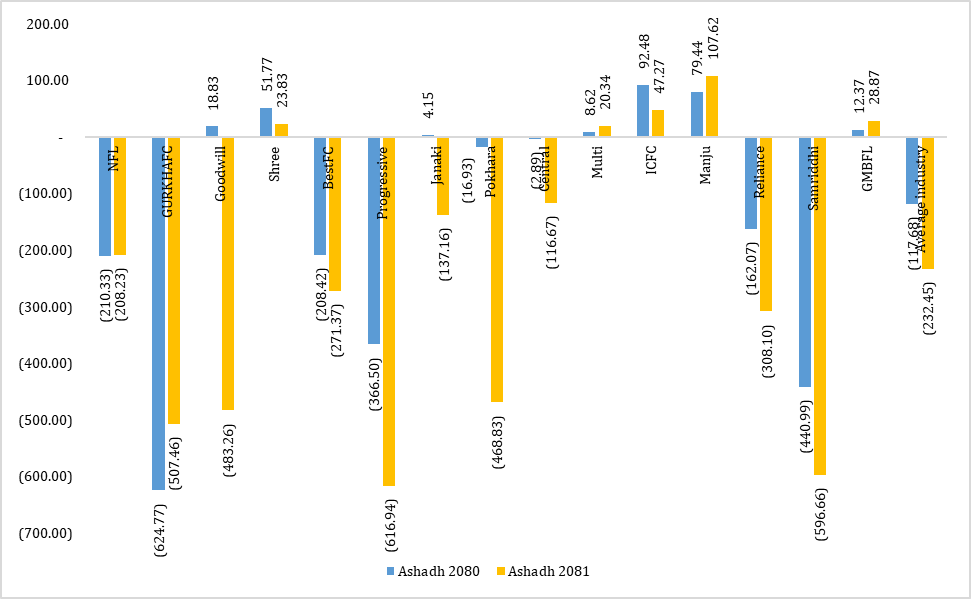
Majority of Finance Companies reported negative distributable profit as on Ashadh 2081 except five Finance Company. Manju Shree Finance Company managed to remain at top position with distributable profit of Rs.107.62 Million with DPS of Rs.7.96 per share followed by ICFC Finance Company with distributable profit of Rs.47.27 Million with DPS of Rs.3.99 per share. Significant raise in distributable profit was reported by Guheshwori Finance Company Limited with raise in Distributable profit from Rs.12.37 Million to Rs.28.87 Million with significant recovery of previous accrued interest. Industrial average distributable profit remained at -232.45 Million as on Ashadh 2081.
Million
|
Finance Company
|
Ashadh 2080
|
Ashadh 2081
|
Change (Rs.)
|
Change%
|
Ranking
|
|
Manju
|
79.44
|
107.62
|
28.18
|
35.47%
|
1
|
|
ICFC
|
92.48
|
47.27
|
(45.20)
|
-48.88%
|
2
|
|
GMBFL
|
12.37
|
28.87
|
16.50
|
133.42%
|
3
|
|
Shree
|
51.77
|
23.83
|
(27.94)
|
-53.98%
|
4
|
|
Multi
|
8.62
|
20.34
|
11.73
|
136.11%
|
5
|
|
Central
|
(2.89)
|
(116.67)
|
(113.78)
|
3941.26%
|
6
|
|
Janaki
|
4.15
|
(137.16)
|
(141.31)
|
-3406.68%
|
7
|
|
NFL
|
(210.33)
|
(208.23)
|
2.10
|
-1.00%
|
8
|
|
BestFC
|
(208.42)
|
(271.37)
|
(62.95)
|
30.20%
|
9
|
|
Reliance
|
(162.07)
|
(308.10)
|
(146.03)
|
90.11%
|
10
|
|
Pokhara
|
(16.93)
|
(468.83)
|
(451.90)
|
2669.35%
|
11
|
|
Goodwill
|
18.83
|
(483.26)
|
(502.09)
|
-2666.84%
|
12
|
|
GURKHAFC
|
(624.77)
|
(507.46)
|
117.32
|
-18.78%
|
13
|
|
Samriddhi
|
(440.99)
|
(596.66)
|
(155.67)
|
35.30%
|
14
|
|
Progressive
|
(366.50)
|
(616.94)
|
(250.44)
|
68.33%
|
15
|
|
Average industry
|
(117.68)
|
(232.45)
|
(114.77)
|
49.37%
|
|
|
DPS
|
|
Finance Company
|
Ashadh 2080
|
Ashadh 2081
|
Change (Rs.)
|
Change (%)
|
Rank
|
|
Manju
|
5.88%
|
7.96%
|
0.02
|
35.47%
|
1
|
|
ICFC
|
7.81%
|
3.99%
|
(0.04)
|
-48.88%
|
2
|
|
Multi
|
1.91%
|
3.33%
|
0.01
|
74.89%
|
3
|
|
GMBFL
|
1.22%
|
2.85%
|
0.02
|
133.42%
|
4
|
|
Shree
|
5.27%
|
2.43%
|
(0.03)
|
-53.98%
|
5
|
|
Central
|
-0.30%
|
-12.30%
|
(0.12)
|
3941.26%
|
6
|
|
Janaki
|
0.60%
|
-19.87%
|
(0.20)
|
-3406.68%
|
7
|
|
Reliance
|
-14.45%
|
-27.47%
|
(0.13)
|
90.11%
|
8
|
|
NFL
|
-28.91%
|
-28.53%
|
0.00
|
-1.32%
|
9
|
|
BestFC
|
-24.38%
|
-31.75%
|
(0.07)
|
30.20%
|
10
|
|
Pokhara
|
-1.56%
|
-43.31%
|
(0.42)
|
2669.35%
|
11
|
|
Goodwill
|
1.99%
|
-51.08%
|
(0.53)
|
-2666.84%
|
12
|
|
GURKHAFC
|
-71.98%
|
-58.46%
|
0.14
|
-18.78%
|
13
|
|
Progressive
|
-43.21%
|
-72.74%
|
(0.30)
|
68.33%
|
14
|
|
Average industry
|
-14.26%
|
-26.52%
|
(0.12)
|
46.21%
|
|
Analysis -11: Non-Banking Assets (NBA)
 |
What Does Non-Banking Assets (NBA) mean to Finance Company?
If a loan provided is defaulted, then Finance Company may sell the collateral held and recover the dues of borrower from such collateral sales. However, sometimes the collateral may not be sold and Finance Company may have to itself take such assets. Such assets are Non-Banking Assets to the Finance Company, which are shown under Investment Property under Balance Sheets.
|
Non- Banking Assets Performance Analysis:
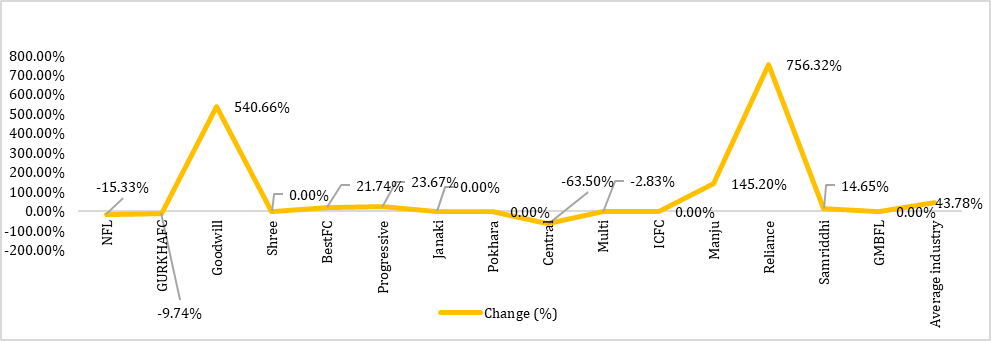
Nine Finance Companies have reported increase in NBA, Four Finance Companies have reported decrease in NBA and Two Finance Companies have reported no change in NBA as compared to earlier year. Goodwill Finance Company booked Rs. 564.66 Million as Non-Finance Companying Assets followed by Gurkhas Finance Company with NBA of Rs.390.43 Million. Pokhara Finance Company had not booked any NBA during Ashadh 2080 but booked NBA of 81.30 Million as on Ashadh 2081. Highest amount of NBA was booked by Goodwill Finance Company of Rs. 564.66 Million in a year up by 540.66% as compared to earlier year. Overall Industry’s NBA increased by 43.78% during the review period.
Million
|
Finance Company
|
Ashadh 2080
|
Ashadh 2081
|
Change (Rs.)
|
Change (%)
|
Ranking
|
|
Central
|
0.68
|
0.25
|
(0.43)
|
-63.50%
|
1
|
|
Janaki
|
0.97
|
0.97
|
-
|
0.00%
|
2
|
|
ICFC
|
4.27
|
4.27
|
-
|
0.00%
|
3
|
|
Multi
|
11.96
|
11.62
|
(0.34)
|
-2.83%
|
4
|
|
GMBFL
|
-
|
12.17
|
12.17
|
0.00%
|
5
|
|
Shree
|
0.00
|
14.60
|
14.60
|
0.00%
|
6
|
|
NFL
|
64.28
|
54.43
|
(9.85)
|
-15.33%
|
7
|
|
Manju
|
25.91
|
63.52
|
37.61
|
145.20%
|
8
|
|
Pokhara
|
-
|
81.30
|
81.30
|
0.00%
|
9
|
|
Progressive
|
101.30
|
125.28
|
23.97
|
23.67%
|
10
|
|
Samriddhi
|
113.58
|
130.21
|
16.64
|
14.65%
|
11
|
|
Reliance
|
24.57
|
210.41
|
185.84
|
756.32%
|
12
|
|
BestFC
|
213.31
|
259.67
|
46.36
|
21.74%
|
13
|
|
GURKHAFC
|
432.55
|
390.43
|
(42.12)
|
-9.74%
|
14
|
|
Goodwill
|
88.14
|
564.66
|
476.52
|
540.66%
|
15
|
|
Average industry
|
72.10
|
128.25
|
56.15
|
43.78%
|
|
Analysis -12: Base Rate
 |
What Does Base Rate mean to Finance Company?
Base Rate is the floor rate upon which premium is charged by Finance Company to derive lending rate. Base rate consists of Cost of Fund, Cost of CRR, Cost of SLR and Operating Costs of the Finance Company. Higher base rate means Finance Company are obtaining funds at higher rate and lower base rate means Finance Company are obtaining funds at lower rates. Higher Base rate also means expensive lending rates and lower base rate means cheaper lending rates.
|
Base Rate Performance Analysis:
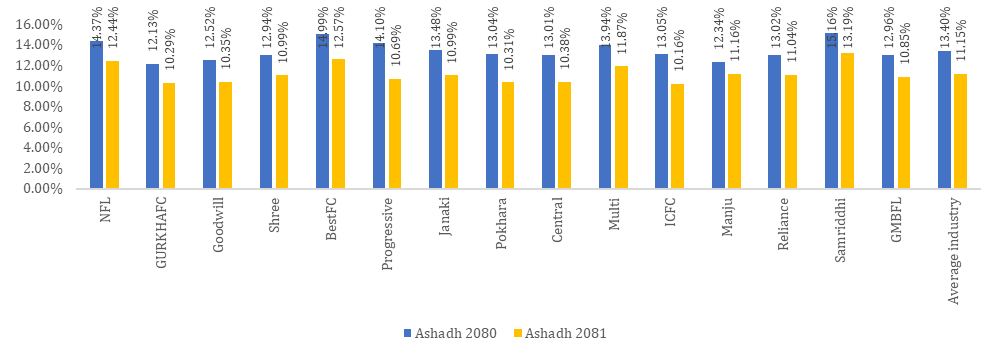
During the review period Industry average base rate remained at 11.15%. As compared to earlier year, Base rate of all the Finance Companies have decreased due to falling cost of deposits. ICFC Finance Company has the lowest Base Rate of 10.16% whereas Samriddhi Finance Company’s base rate of 13.19% is the highest amongst peer.
|
Finance Company
|
Ashadh 2080
|
Ashadh 2081
|
Change (Rs.)
|
Change%
|
Ranking
|
|
ICFC
|
13.05%
|
10.16%
|
-2.89%
|
-22.15%
|
1
|
|
GURKHAFC
|
12.13%
|
10.29%
|
-1.84%
|
-15.17%
|
2
|
|
Pokhara
|
13.04%
|
10.31%
|
-2.73%
|
-20.94%
|
3
|
|
Goodwill
|
12.52%
|
10.35%
|
-2.17%
|
-17.33%
|
4
|
|
Central
|
13.01%
|
10.38%
|
-2.63%
|
-20.22%
|
5
|
|
Progressive
|
14.10%
|
10.69%
|
-3.41%
|
-24.18%
|
6
|
|
GMBFL
|
12.96%
|
10.85%
|
-2.11%
|
-16.28%
|
7
|
|
Shree
|
12.94%
|
10.99%
|
-1.95%
|
-15.07%
|
8
|
|
Janaki
|
13.48%
|
10.99%
|
-2.49%
|
-18.47%
|
8
|
|
Reliance
|
13.02%
|
11.04%
|
-1.98%
|
-15.21%
|
10
|
|
Manju
|
12.34%
|
11.16%
|
-1.18%
|
-9.56%
|
11
|
|
Multi
|
13.94%
|
11.87%
|
-2.07%
|
-14.85%
|
12
|
|
NFL
|
14.37%
|
12.44%
|
-1.93%
|
-13.43%
|
13
|
|
BestFC
|
14.99%
|
12.57%
|
-2.42%
|
-16.14%
|
14
|
|
Samriddhi
|
15.16%
|
13.19%
|
-1.97%
|
-12.99%
|
15
|
|
Average industry
|
13.40%
|
11.15%
|
-2.25%
|
|
|
Analysis -13: Earning Per Share (EPS)
 |
What Does Earning Per Share mean to Finance Company?
Earnings Per Share (EPS) is the amount of profit earned by the Finance Company equivalent to each of its share. Higher the EPS, better it is and vice versa. It is computed by dividing Net Profit by total number of shares of the Finance Company.
|
Earnings Per Share Performance Analysis:
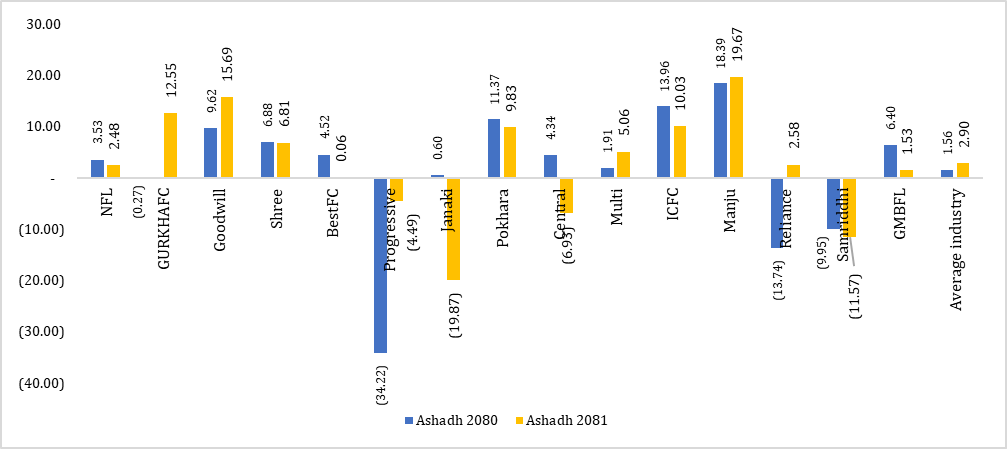
Manjushree Finance Company has the highest EPS of Rs.19.67 per share followed by Goodwill Finance Company with Rs.15.69 per share. 4 Finance Company have their negative EPS and 9 Finance Company have decrease the EPS as compare to previous year. Industry Average EPS is 2.90. Janaki Finance has lowest EPS i.e. negative 19.87.
|
Finance Company
|
Ashadh 2080
|
Ashadh 2081
|
Change (Rs.)
|
Change%
|
Ranking
|
|
Manju
|
18.39
|
19.67
|
1.28
|
6.96%
|
1
|
|
Goodwill
|
9.62
|
15.69
|
6.07
|
63.10%
|
2
|
|
GURKHAFC
|
(0.27)
|
12.55
|
12.82
|
-4748.15%
|
3
|
|
ICFC
|
13.96
|
10.03
|
(3.93)
|
-28.15%
|
4
|
|
Pokhara
|
11.37
|
9.83
|
(1.54)
|
-13.54%
|
5
|
|
Shree
|
6.88
|
6.81
|
(0.07)
|
-1.02%
|
6
|
|
Multi
|
1.91
|
5.06
|
3.15
|
164.92%
|
7
|
|
Reliance
|
(13.74)
|
2.58
|
16.32
|
-118.78%
|
8
|
|
NFL
|
3.53
|
2.48
|
(1.05)
|
-29.75%
|
9
|
|
GMBFL
|
6.40
|
1.53
|
(4.87)
|
-76.09%
|
10
|
|
BestFC
|
4.52
|
0.06
|
(4.46)
|
-98.67%
|
11
|
|
Progressive
|
(34.22)
|
(4.49)
|
29.73
|
-86.88%
|
12
|
|
Central
|
4.34
|
(6.93)
|
(11.27)
|
-259.68%
|
13
|
|
Samriddhi
|
(9.95)
|
(11.57)
|
(1.62)
|
16.28%
|
14
|
|
Janaki
|
0.60
|
(19.87)
|
(20.47)
|
-3411.67%
|
15
|
|
Average industry
|
1.56
|
2.90
|
1.34
|
46.26%
|
|
Analysis -14: Non-Performing Loan (NPL)
 |
What Does Non-Performing Loan mean to Finance Company?
Non-Performing Loans (NPL) are those loans which are classified under Doubtful, Substandard and Bad as per the NRB provisions. Higher Non-Performing Loans ratio means higher probability of loan defaults, so Finance Company try to maintain NPL as low as possible.
|
Non-Performing Loans (NPL) Performance Analysis:
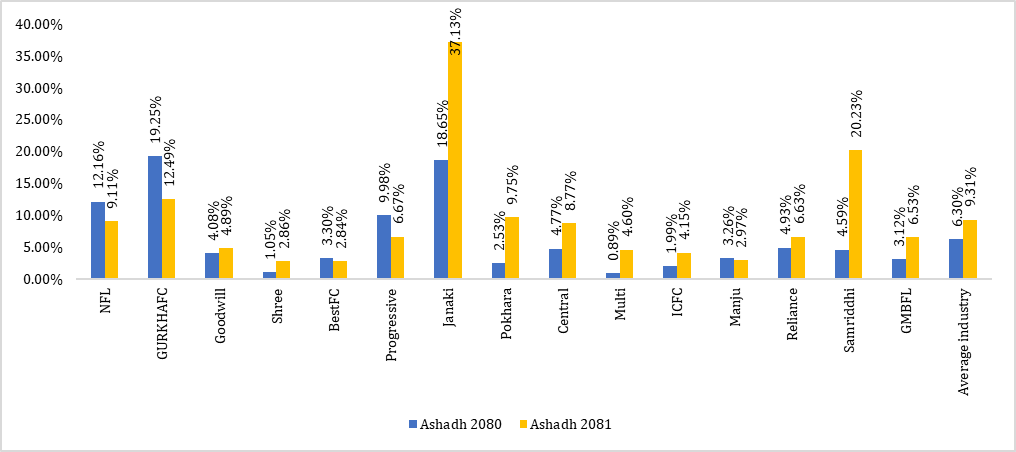
Industry Average non-performing loan (NPL) of overall industry remained at 9.31% as on Ashadh 2081. Higher NPL triggers increased risk of credit defaults and lower changes of credit recovery, so Finance Company’s try to restrict their NPL as low as possible. During the review period, Best Finance Company managed to keep its NPL at 2.84% which is lowest amongst peers, followed by Shree Investment Finance Company with 2.86% NPL. Highest NPL was reported by Janaki Finance with NPL of 4.95% followed by Samriddhi Finance with NPL 20.23% as on Ashadh 2081. Considering Y-o-Y growth, NPL of Janaki Finance Company’s growth of 18.48% was highest amongst the peer.
|
Finance Company
|
Ashadh 2080
|
Ashadh 2081
|
YOY Change
|
Ranking
|
|
BestFC
|
3.30%
|
2.84%
|
-0.46%
|
1
|
|
Shree
|
1.05%
|
2.86%
|
1.81%
|
2
|
|
Manju
|
3.26%
|
2.97%
|
-0.29%
|
3
|
|
ICFC
|
1.99%
|
4.15%
|
2.16%
|
4
|
|
Multi
|
0.89%
|
4.60%
|
3.71%
|
5
|
|
Goodwill
|
4.08%
|
4.89%
|
0.81%
|
6
|
|
GMBFL
|
3.12%
|
6.53%
|
3.41%
|
7
|
|
Reliance
|
4.93%
|
6.63%
|
1.70%
|
8
|
|
Progressive
|
9.98%
|
6.67%
|
-3.31%
|
9
|
|
Central
|
4.77%
|
8.77%
|
4.00%
|
10
|
|
NFL
|
12.16%
|
9.11%
|
-3.05%
|
11
|
|
Pokhara
|
2.53%
|
9.75%
|
7.22%
|
12
|
|
GURKHAFC
|
19.25%
|
12.49%
|
-6.76%
|
13
|
|
Samriddhi
|
4.59%
|
20.23%
|
15.64%
|
14
|
|
Janaki
|
18.65%
|
37.13%
|
18.48%
|
15
|
|
Average industry
|
6.30%
|
9.31%
|
3.00%
|
|
Analysis -15: Cost of Fund
 |
What Does Cost of Fund mean to Finance Company?
Cost of Fund means the cost incurred by the Finance Company to obtain funds in a form of deposit or borrowings. It includes cost of local currency deposit and borrowings obtained by the Finance Company.
|
Cost of Fund Performance Analysis:
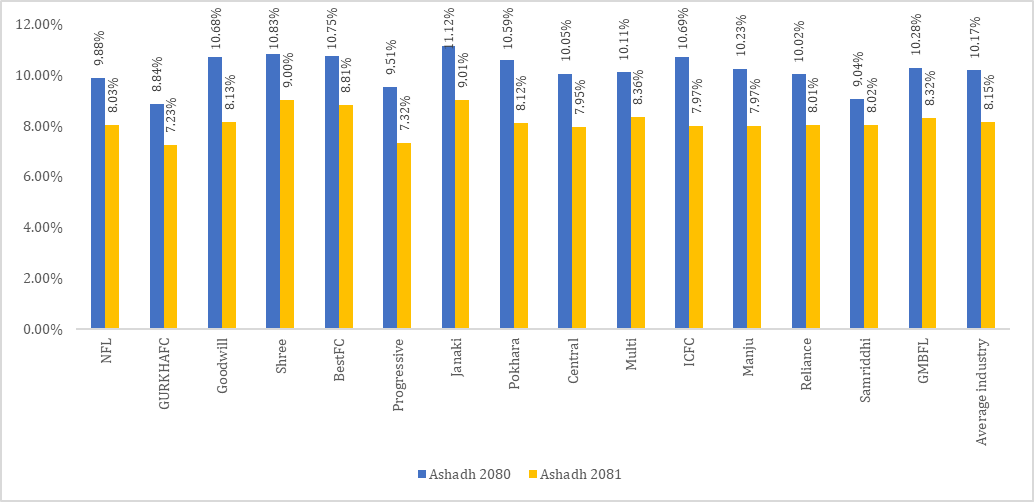
During the review period lowest cost of fund was of Gurkhas Finance Company at 7.23% followed by Progressive Finance Company with 7.32%. This means these Finance Company are soliciting funds at lower costs than peers. However, cost of fund of Janaki Finance Company remained highest amongst peer at 9.01% as on Ashadh 2081. Industry average cost of fund remained at 8.15% as on Ashadh 2081.
|
Finance Company
|
Ashadh 2080
|
Ashadh 2081
|
YOY Change
|
Ranking
|
|
GURKHAFC
|
8.84%
|
7.23%
|
-1.61%
|
1
|
|
Progressive
|
9.51%
|
7.32%
|
-2.19%
|
2
|
|
Central
|
10.05%
|
7.95%
|
-2.10%
|
3
|
|
ICFC
|
10.69%
|
7.97%
|
-2.72%
|
4
|
|
Manju
|
10.23%
|
7.97%
|
-2.26%
|
4
|
|
Reliance
|
10.02%
|
8.01%
|
-2.01%
|
6
|
|
Samriddhi
|
9.04%
|
8.02%
|
-1.02%
|
7
|
|
NFL
|
9.88%
|
8.03%
|
-1.85%
|
8
|
|
Pokhara
|
10.59%
|
8.12%
|
-2.47%
|
9
|
|
Goodwill
|
10.68%
|
8.13%
|
-2.55%
|
10
|
|
GMBFL
|
10.28%
|
8.32%
|
-1.96%
|
11
|
|
Multi
|
10.11%
|
8.36%
|
-1.75%
|
12
|
|
BestFC
|
10.75%
|
8.81%
|
-1.94%
|
13
|
|
Shree
|
10.83%
|
9.00%
|
-1.83%
|
14
|
|
Janaki
|
11.12%
|
9.01%
|
-2.11%
|
15
|
|
Average industry
|
10.17%
|
8.15%
|
-2.02%
|
|
Analysis -16: Capital Adequacy Ratio (CAR)
 |
What Does Capital Adequacy Ratio mean to Finance Company?
Capital Adequacy Ratio (CAR) measures the sufficiency of Finance Company’s capital in terms of its credit, operation and market or liquidity risk weighted exposures. It indicates the sufficiency of Finance Company’s capital commensurate to risk pertaining to business growth, gross income and open position. NRB has mandated Finance Company to maintain CAR of at least 10% in line with Capital Adequacy Framework, 2007.
|
Capital Adequacy Ratio (CAR) Performance Analysis:
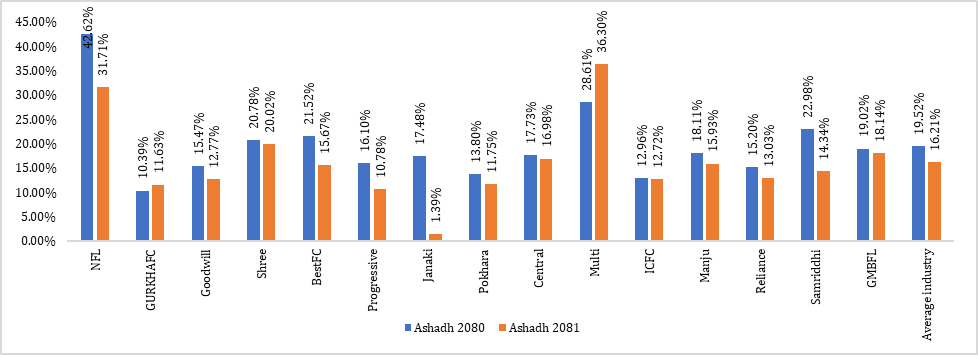
Industrial average CAR remained at 16.21% as on Ashadh 2081. Multipurpose Finance Company managed to remain at top with CAR of 36.30% whose Y-o-Y CAR increased by 7.69% as compared to earlier year followed by Nepal Finance Limited with CAR of 31.71% a down of 10.91% from earlier year. Lowest CAR was reported by Janaki Finance 1.39% followed by Progressive Finance Company of 10.78%.
|
Finance Company
|
Ashadh 2080
|
Ashadh 2081
|
YOY Change
|
Ranking
|
|
Multi
|
28.61%
|
36.30%
|
7.69%
|
1
|
|
NFL
|
42.62%
|
31.71%
|
-10.91%
|
2
|
|
Shree
|
20.78%
|
20.02%
|
-0.76%
|
3
|
|
GMBFL
|
19.02%
|
18.14%
|
-0.88%
|
4
|
|
Central
|
17.73%
|
16.98%
|
-0.75%
|
5
|
|
Manju
|
18.11%
|
15.93%
|
-2.18%
|
6
|
|
BestFC
|
21.52%
|
15.67%
|
-5.85%
|
7
|
|
Samriddhi
|
22.98%
|
14.34%
|
-8.64%
|
8
|
|
Reliance
|
15.20%
|
13.03%
|
-2.17%
|
9
|
|
Goodwill
|
15.47%
|
12.77%
|
-2.70%
|
10
|
|
ICFC
|
12.96%
|
12.72%
|
-0.24%
|
11
|
|
Pokhara
|
13.80%
|
11.75%
|
-2.05%
|
12
|
|
GURKHAFC
|
10.39%
|
11.63%
|
1.24%
|
13
|
|
Progressive
|
16.10%
|
10.78%
|
-5.32%
|
14
|
|
Janaki
|
17.48%
|
1.39%
|
-16.09%
|
15
|
|
Average industry
|
19.52%
|
16.21%
|
-3.31%
|
|
Analysis -17: Credit to Deposit (CD) Ratio
 |
What Does CD Ratio mean to Finance Company?
Credit to Deposit (CD) ratio is the measure which shows proportion of credit and deposit mix of the Finance Company. Higher CD ratio means higher portion of lending as compared to Finance Company’s deposit volume and lower CD ration means lower portion of lending as compared to Finance Company’s deposit volume. Finance Company try to maintain optimum CD ratio by balancing between credit and deposit mix.
|
Credit to Deposit (CD) ratio Performance Analysis:
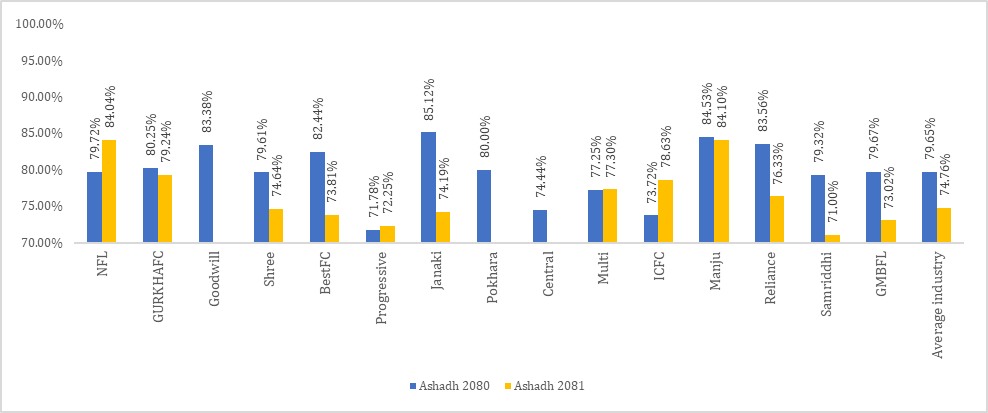
During the review period industrial average CD ratio remained at 74.76%. Manju Shree Finance Company had the highest CD ratio of 84.10% followed by Nepal Finance Company of 84.04%. Lowest CD ratio was reported by Central Finance Company of 65.08% a fall by 9.36% as compared to earlier year.
|
Finance Company
|
Ashadh 2080
|
Ashadh 2081
|
Change
|
Ranking
|
|
Manju
|
84.53%
|
84.10%
|
-0.43%
|
1
|
|
NFL
|
79.72%
|
84.04%
|
4.32%
|
2
|
|
GURKHAFC
|
80.25%
|
79.24%
|
-1.01%
|
3
|
|
ICFC
|
73.72%
|
78.63%
|
4.91%
|
4
|
|
Multi
|
77.25%
|
77.30%
|
0.05%
|
5
|
|
Reliance
|
83.56%
|
76.33%
|
-7.23%
|
6
|
|
Shree
|
79.61%
|
74.64%
|
-4.97%
|
7
|
|
Janaki
|
85.12%
|
74.19%
|
-10.93%
|
8
|
|
BestFC
|
82.44%
|
73.81%
|
-8.63%
|
9
|
|
GMBFL
|
79.67%
|
73.02%
|
-6.65%
|
10
|
|
Progressive
|
71.78%
|
72.25%
|
0.47%
|
11
|
|
Samriddhi
|
79.32%
|
71.00%
|
-8.32%
|
12
|
|
Goodwill
|
83.38%
|
69.78%
|
-13.60%
|
13
|
|
Pokhara
|
80.00%
|
67.96%
|
-12.04%
|
14
|
|
Central
|
74.44%
|
65.08%
|
-9.36%
|
15
|
|
Average industry
|
79.65%
|
74.76%
|
-4.89%
|
|
Summary of Key Performance Indicators (Ashadh 2081)
Balance Sheet Key Indicators
|
Finance Company
|
Loan (Billion)
|
Ranking
|
Deposit (Billion)
|
Ranking
|
Non-Banking Assets (Million)
|
Ranking
|
|
Manju
|
16
|
1
|
18
|
2
|
63.52
|
8
|
|
ICFC
|
15
|
2
|
19
|
1
|
4.27
|
3
|
|
Pokhara
|
9
|
3
|
13
|
3
|
81.30
|
9
|
|
Goodwill
|
8
|
4
|
13
|
4
|
564.66
|
15
|
|
GURKHAFC
|
7
|
5
|
10
|
5
|
390.00
|
14
|
|
Reliance
|
6
|
6
|
8
|
7
|
210.41
|
12
|
|
GMBFL
|
6
|
7
|
8
|
6
|
12.17
|
5
|
|
Shree
|
6
|
8
|
7
|
9
|
14.60
|
6
|
|
Central
|
5
|
9
|
8
|
8
|
0.25
|
1
|
|
Progressive
|
4
|
10
|
6
|
10
|
125.28
|
10
|
|
BestFC
|
4
|
11
|
5
|
11
|
259.67
|
13
|
|
Janaki
|
3
|
12
|
4
|
12
|
0.97
|
2
|
|
NFL
|
2
|
13
|
3
|
13
|
54.43
|
7
|
|
Samriddhi
|
2
|
14
|
2
|
14
|
130.21
|
11
|
|
Multi
|
1
|
15
|
2
|
15
|
11.62
|
4
|
|
Average Industry
|
6.26
|
|
8.45
|
|
128.22
|
|
Profitability, Income and Expenses Indicators
|
Finance Company
|
NII
|
Rank
|
Net Fee and Commission Income
|
Rank
|
Impairment Charge
|
Rank
|
Personnel Expenses (Excluding. Bonus)
|
Rank
|
|
NFL
|
111
|
13
|
13
|
11
|
6
|
4
|
5
|
3
|
|
GURKHAFC
|
315
|
4
|
46
|
3
|
(55)
|
1
|
5
|
9
|
|
Goodwill
|
319
|
3
|
45
|
4
|
(30)
|
2
|
6
|
10
|
|
Shree
|
212
|
8
|
28
|
6
|
22
|
7
|
5
|
5
|
|
BestFC
|
123
|
11
|
26
|
7
|
(19)
|
3
|
5
|
6
|
|
Progressive
|
152
|
10
|
1
|
15
|
19
|
6
|
4
|
2
|
|
Janaki
|
113
|
12
|
6
|
14
|
212
|
14
|
7
|
14
|
|
Pokhara
|
308
|
5
|
19
|
10
|
453
|
15
|
7
|
13
|
|
Central
|
231
|
6
|
22
|
9
|
167
|
13
|
5
|
4
|
|
Multi
|
90
|
14
|
12
|
12
|
38
|
8
|
5
|
7
|
|
ICFC
|
542
|
2
|
86
|
2
|
151
|
12
|
8
|
15
|
|
Manju
|
755
|
1
|
88
|
1
|
92
|
11
|
7
|
12
|
|
Reliance
|
218
|
7
|
42
|
5
|
17
|
5
|
5
|
8
|
|
Samriddhi
|
84
|
15
|
7
|
13
|
91
|
10
|
6
|
11
|
|
GMBFL
|
176
|
9
|
24
|
8
|
75
|
9
|
4
|
1
|
|
Average industry
|
250
|
|
31
|
|
82
|
|
6
|
|
|
Finance Company
|
Operating Expenses
|
Rank
|
Write off
|
Rank
|
PAT
|
Rank
|
Distributable Profit
|
Rank
|
|
NFL
|
3
|
10
|
-
|
1
|
18
|
8
|
(208)
|
8
|
|
GURKHAFC
|
3
|
7
|
40
|
16
|
109
|
4
|
(507)
|
13
|
|
Goodwill
|
5
|
15
|
-
|
1
|
148
|
2
|
(483)
|
12
|
|
Shree
|
4
|
11
|
-
|
1
|
67
|
5
|
24
|
4
|
|
BestFC
|
3
|
3
|
29
|
15
|
0
|
10
|
(271)
|
9
|
|
Progressive
|
4
|
13
|
0
|
10
|
(38)
|
11
|
(617)
|
15
|
|
Janaki
|
5
|
14
|
-
|
1
|
(137)
|
15
|
(137)
|
7
|
|
Pokhara
|
3
|
4
|
-
|
1
|
(106)
|
14
|
(469)
|
11
|
|
Central
|
3
|
2
|
0
|
11
|
(64)
|
12
|
(117)
|
6
|
|
Multi
|
3
|
9
|
2
|
12
|
20
|
7
|
20
|
5
|
|
ICFC
|
4
|
12
|
-
|
1
|
119
|
3
|
47
|
2
|
|
Manju
|
3
|
5
|
24
|
14
|
266
|
1
|
108
|
1
|
|
Reliance
|
3
|
8
|
-
|
1
|
29
|
6
|
(308)
|
10
|
|
Samriddhi
|
3
|
6
|
0
|
9
|
(95)
|
13
|
(597)
|
14
|
|
GMBFL
|
1
|
1
|
-
|
1
|
15
|
9
|
29
|
3
|
|
Average industry
|
3
|
|
6
|
|
23
|
|
(232)
|
|
Ratios
|
Finance Company
|
EPS
|
Rank
|
DPS
|
Rank
|
Base Rate
|
Rank
|
NPL
|
Rank
|
COF
|
Rank
|
CAR
|
Rank
|
CD Ratio
|
Rank
|
|
NFL
|
2.48
|
9
|
(208.23)
|
8
|
12.44%
|
13
|
9.11%
|
11
|
8.03%
|
8
|
31.71%
|
2
|
84.04%
|
2
|
|
GURKHAFC
|
12.55
|
3
|
(507.46)
|
13
|
10.29%
|
2
|
12.49%
|
13
|
7.23%
|
1
|
11.63%
|
13
|
79.24%
|
3
|
|
Goodwill
|
15.69
|
2
|
(483.26)
|
12
|
10.35%
|
4
|
4.89%
|
6
|
8.13%
|
10
|
12.77%
|
10
|
69.78%
|
13
|
|
Shree
|
6.81
|
6
|
23.83
|
4
|
10.99%
|
8
|
2.86%
|
2
|
9.00%
|
14
|
20.02%
|
3
|
74.64%
|
7
|
|
BestFC
|
0.06
|
11
|
(271.37)
|
9
|
12.57%
|
14
|
2.84%
|
1
|
8.81%
|
13
|
15.67%
|
7
|
73.81%
|
9
|
|
Progressive
|
(4.49)
|
12
|
(616.94)
|
15
|
10.69%
|
6
|
6.67%
|
9
|
7.32%
|
2
|
10.78%
|
14
|
72.25%
|
11
|
|
Janaki
|
(19.87)
|
15
|
(137.16)
|
7
|
10.99%
|
8
|
37.13%
|
15
|
9.01%
|
15
|
1.39%
|
15
|
74.19%
|
8
|
|
Pokhara
|
9.83
|
5
|
(468.83)
|
11
|
10.31%
|
3
|
9.75%
|
12
|
8.12%
|
9
|
11.75%
|
12
|
67.96%
|
14
|
|
Central
|
(6.93)
|
13
|
(116.67)
|
6
|
10.38%
|
5
|
8.77%
|
10
|
7.95%
|
3
|
16.98%
|
5
|
65.08%
|
15
|
|
Multi
|
5.06
|
7
|
20.34
|
5
|
11.87%
|
12
|
4.60%
|
5
|
8.36%
|
12
|
36.30%
|
1
|
77.30%
|
5
|
|
ICFC
|
10.03
|
4
|
47.27
|
2
|
10.16%
|
1
|
4.15%
|
4
|
7.97%
|
4
|
12.72%
|
11
|
78.63%
|
4
|
|
Manju
|
19.67
|
1
|
107.62
|
1
|
11.16%
|
11
|
2.97%
|
3
|
7.97%
|
4
|
15.93%
|
6
|
84.10%
|
1
|
|
Reliance
|
2.58
|
8
|
(308.10)
|
10
|
11.04%
|
10
|
6.63%
|
8
|
8.01%
|
6
|
13.03%
|
9
|
76.33%
|
6
|
|
Samriddhi
|
(11.57)
|
14
|
(596.66)
|
14
|
13.19%
|
15
|
20.23%
|
14
|
8.02%
|
7
|
14.34%
|
8
|
71.00%
|
12
|
|
GMBFL
|
1.53
|
10
|
28.87
|
3
|
10.85%
|
7
|
6.53%
|
7
|
8.32%
|
11
|
18.14%
|
4
|
73.02%
|
10
|
|
Average industry
|
2.90
|
|
(232.45)
|
|
11.15%
|
|
9.31%
|
|
8%
|
|
16.21%
|
|
74.76%
|
|
**************
Note:- Due to non-availability of data for Capital Merchant Finance and Nepal Share Market Limited, the data of these two finance companies are not presented in above analysis.


